
FIGURE 2.
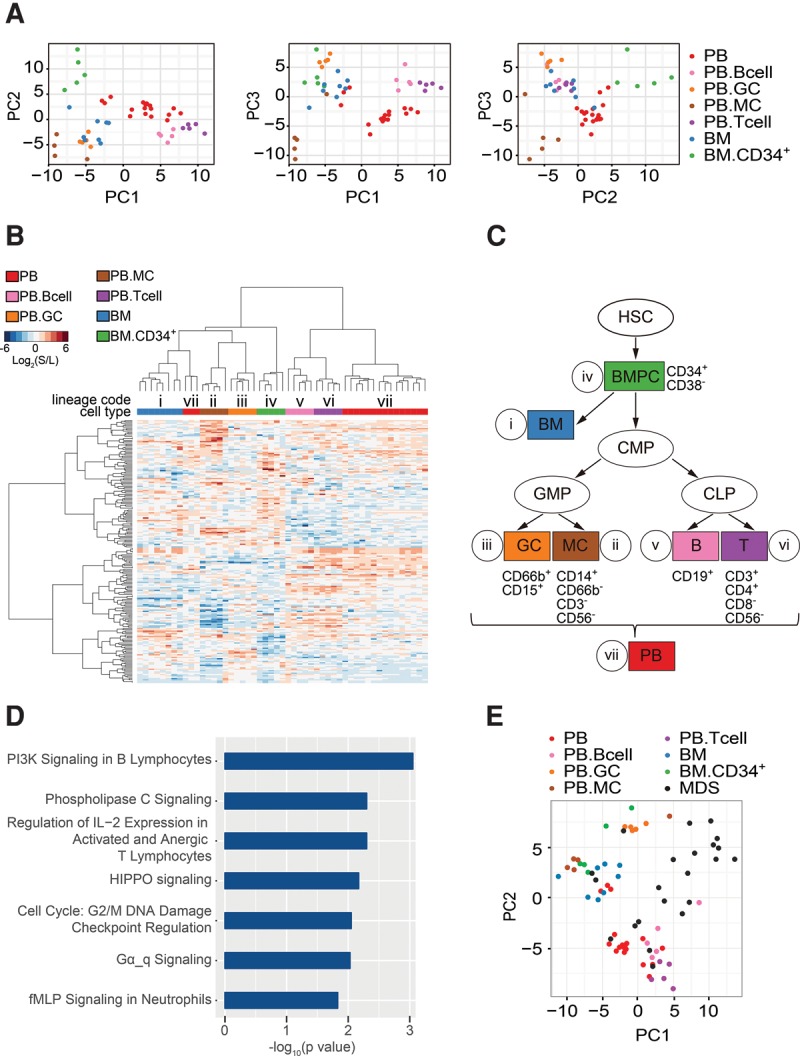
Characterization of hematopoietic lineage-defining splicing programs. (A) Principal component analysis (PCA) represents the results of regression analysis that identified a splicing program that differentiates between normal hematopoietic cell lineages (Hemo-SP panel). (B) Unsupervised hierarchical clustering of normal hematopoietic cell samples using the 200-event cell lineage-specific panel (Hemo-SP). A code was assigned to each lineage. Unsupervised hierarchical clustering of MDS blood samples with fixed 200-event panel as used. (C) A demonstration tree of hematopoietic lineages. Hematopoietic stem cell (HSC); bone marrow progenitor cells (BMPC); bone marrow (BM); common myeloid progenitor cell (CMP); granulocyte (GC); monocyte (MC); B-lymphocyte (B); T-lymphocyte (T); peripheral blood (PB). As CMP and SC were very well correlated across all events, and each group had limited sample numbers, we combined these two groups together as CMP. (D) Canonical pathways identified by Ingenuity IPA analysis of the hematopoietic lineage-specific panel (Hemo-SP). (E) Segregation of MDS samples from different cell types from healthy controls based on Hemo-SP by PCA.