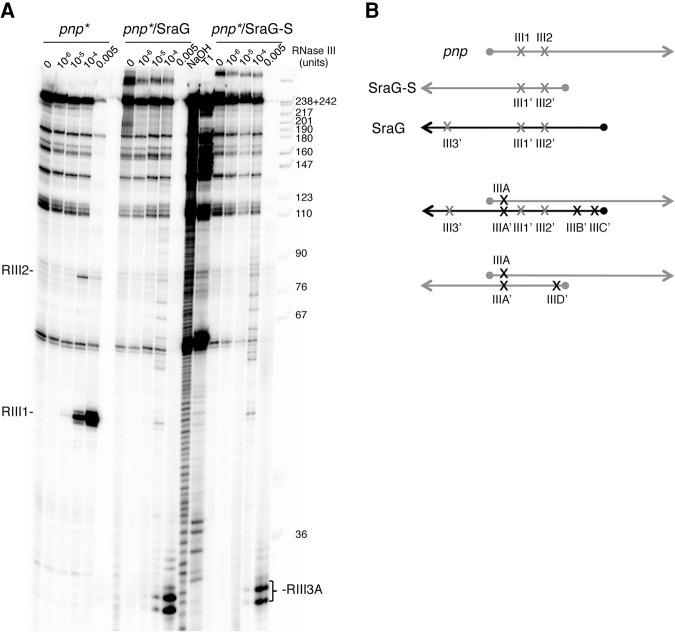
FIGURE 5.
Both SraG and SraG-S promote new RNase III cleavages in pnp mRNA in vitro. (A) RNase III hydrolysis of 5′-end-labeled pnp mRNA (pnp*) free or in the presence of a molar ratio of SraG or SraG-S. Increasing amounts of RNase III (10−6–5.10−3 units) were added to the pnp* RNA alone or in complex with SraG or SraG-S. Lanes T1 and NaOH indicate RNase T1 and alkaline ladders, respectively, of pnp*. See Supplemental Figure S5 for cleavages on the SraG RNAs. (B) Schematic representation of the RNase III processing sites on pnp (light gray), SraG (black), and SraG-S (dark gray), and pnp-SraG and pnp-SraG-S duplexes. Light gray crosses represent cleavages observed on both the single RNA molecules and when they are in duplex, black crosses indicate cleavages only observed after duplex formation. A dot represents the 5′-triphosphate extremity of the various RNA molecules.

