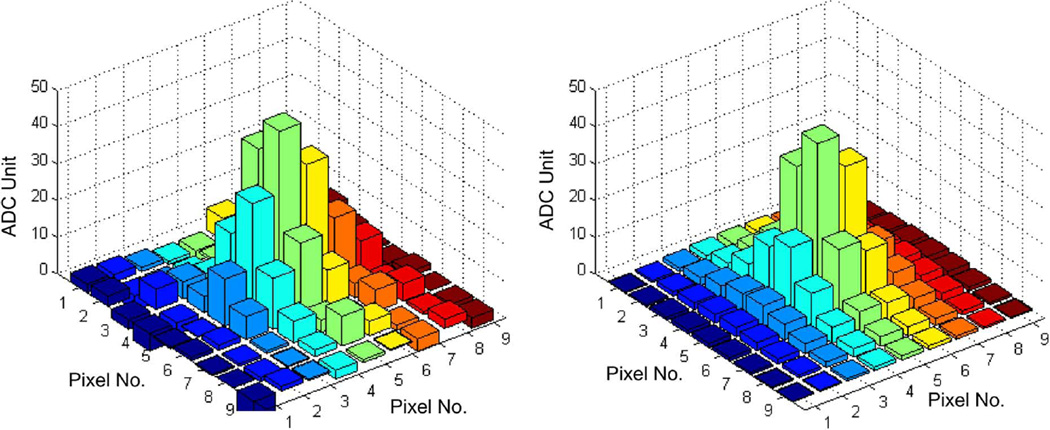
Fig. 3.
Measured (left) and fitted (right) signal distribution on EMCCD, induced by an I-125 photon interaction in a 500 µm thick columnar CsI(Tl) scintillator. The horizontal axes are EMCCD pixel numbers and the pixel size was 16 µm × 16 µm. The vertical axis is the measured signal amplitude in ADC unit (ADU). A relatively low EM gain of 20 was used in this measurement. The RMS of the distribution (on EMCCD) is ~ 20µm, which is corresponding to ~ 120µm RMS on the photocathode of the DM tube. The total distribution contains ~ 20 photoelectrons, which was derived based on the calibration process described in Section II-B. In this measurement, a single photoelectron is corresponding to roughly 13 ADC units.

