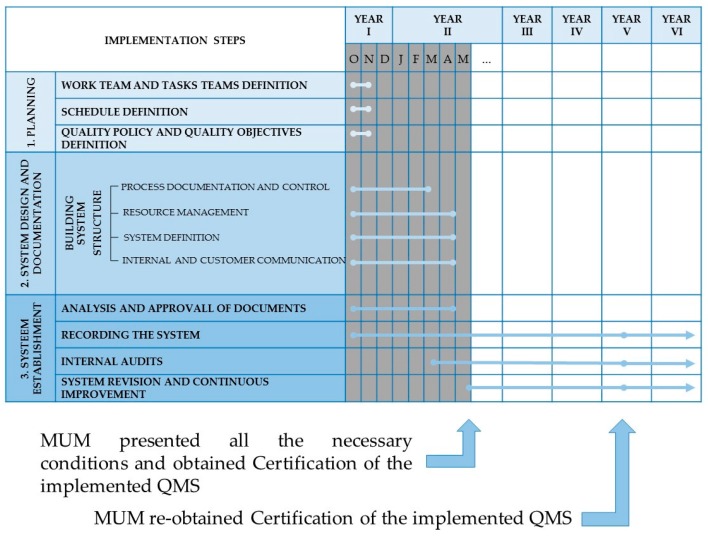
Figure 1.
Timeline of the different phases from the implementation steps (grey area) until current state of the Quality Management System of the Micoteca da Universidade do Minho (MUM). The blue lines in bold represent the duration of the item during the represented timeline. The grey columns represent the time previous to certification. O, N, D, J, F, M, A and, M, under year I and year II, correspond to the months.

