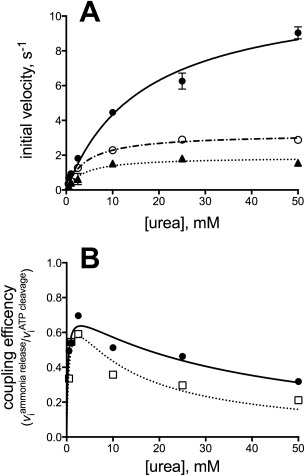
Figure 4.

Coupling of NH3 release with ATP cleavage for the reaction catalyzed by PsUC and PsAH. (A) ATP cleavage (solid line, filled circles) and NH3 production (dashed lines) as a function of urea concentration for the combined activities of PsUC and PsAH. The rate of NH3 production was determined when PsUC and PsAH were combined at a 1:1 molar ratio (dotted line; closed triangles) and at a 1:10 molar ratio (dashed‐dotted line; open circles). The lines represent the non‐linear regression fit to the standard Michaelis‐Menten equation. (B) Replot of the ratio of NH3 production rate to ATP cleavage rate for a molar ratio of 1:1 PsUC:PsAH (dotted line; open squares) and 1:10 PsUC:PsAH (solid line; closed circles), respectively, at varying concentrations of urea. The lines represent the nonlinear regression fit to a modified form of the Michaelis–Menten equation describing classic, competitive substrate inhibition.
