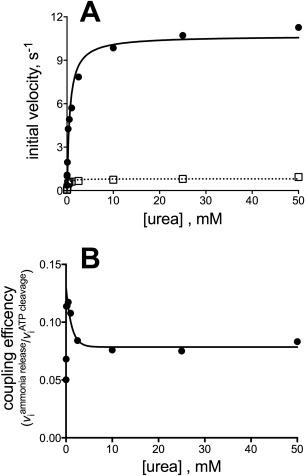
Figure 5.

Coupling of NH3 release with ATP cleavage for the reaction catalyzed by ScUAL. (A) ATP cleavage (solid line, filled circles) and NH3 production (dashed line; open squares) as a function of urea concentration. The lines represent the nonlinear regression fit to the standard Michaelis–Menten equation. (B) Replot of the ratio of NH3 production rate to ATP cleavage rate. The lines represent the nonlinear regression fit to the equation describing exponential decay.
