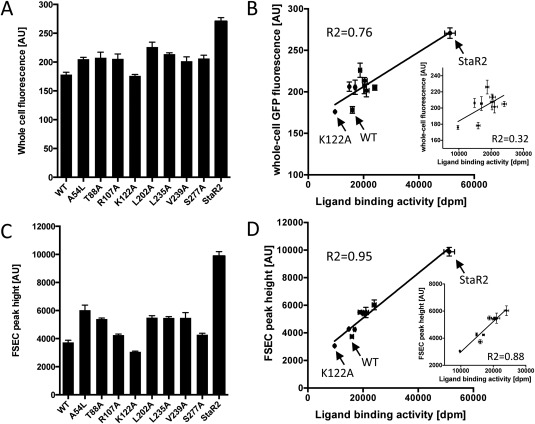
Figure 4.

Whole‐cell fluorescence, FSEC peak height, and ligand binding activity. (A) Whole‐cell fluorescence of A2A‐WT, the single mutants, and StaR2. (B) Correlation between the whole‐cell fluorescence and ligand binding activity. Inset is the same plot without StaR2. Correlation coefficients (R 2) are shown. (C) Peak height of FSEC chromatograms of A2A‐WT, the single mutants, and StaR2. The chromatograms are shown in Supporting Information Figure S4. (D) Correlation between the peak height and ligand binding activity. Inset is the same plot without StaR2. Correlation coefficients (R 2) are shown. Mean values ± the standard deviations (SD) of four wells are shown.
