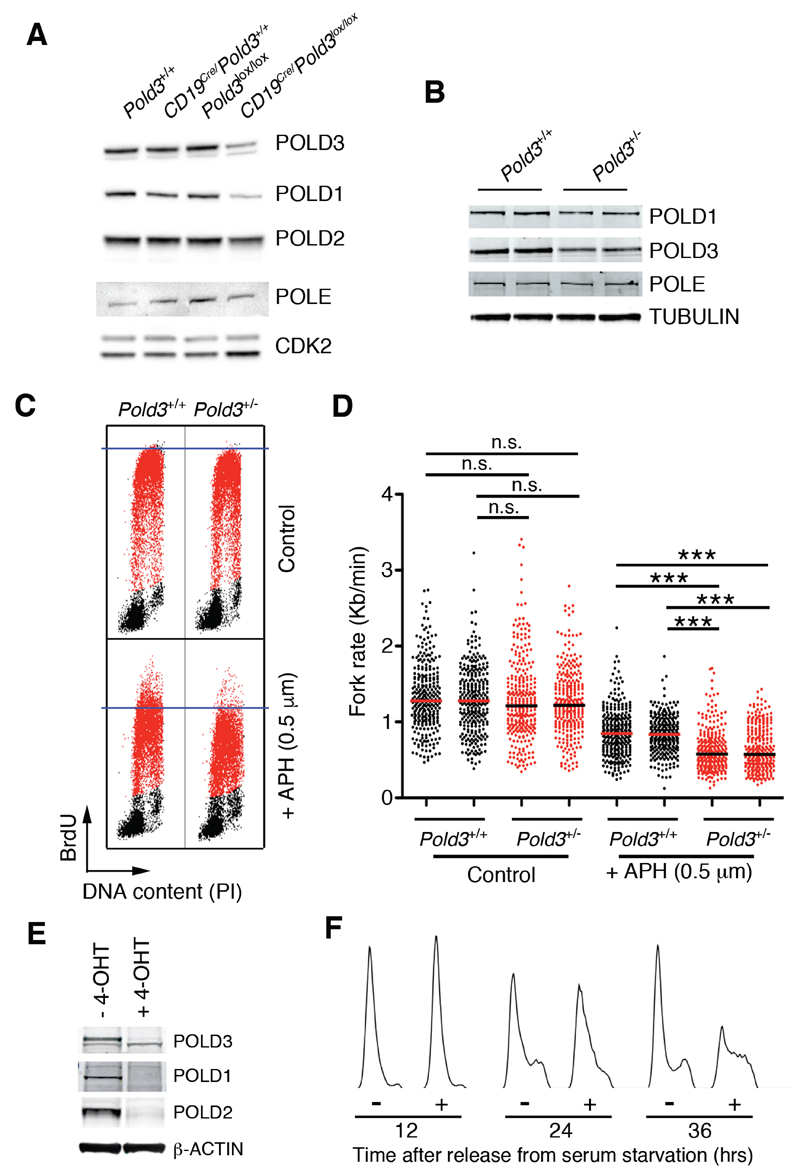
Figure 4. POLD3 maintains the stability of the POLD complex.
(A) WB illustrating the levels of POLD1, POLD2, POLD3 and POLE in B cell cultures from the indicated genotypes, 48 hrs after stimulation with LPS (25 μg/ml). CDK2 was used as a loading control.
(B) WB of POLD1, POLD3 and POLE levels from Pold3+/+ and Pold3+/- B cells. TUBULIN is shown as a loading control.
(C) Representative FACS analysis of DNA content (PI) versus BrdU incorporation in Pold3+/+ and Pold3+/- B cells. 48 hrs after stimulation with LPS (25 μg/ml) cells were exposed (or not) to 0.5 μM aphidicolin (APH) for 4 hrs, and then to BrdU (10μM) for another 30 min. Note that the APH treatment had a bigger impact on in limiting DNA replication on Pold3 heterozygous cells.
(D) Fork rates were measured in stretched DNA fibers prepared from B cells of the indicated genotypes treated as in (C). Data from two independent B cell cultures of each genotype are shown. Approximately 300 tracks were measured to estimate fork rates in each condition. ***P<0.001.
(E) WB illustrating the levels of POLD1, POLD2 and POLD3 in UbCre/Pold3lox/lox MEF exposed (or not) to 4-OHT (1 μM) and that were serum starved (0.1% serum) for 72 hrs and subsequently released in 15% serum-containing media for 24 hrs.
(F) FACS analyses of DNA content (PI) from UbCre/Pold3lox/lox MEF exposed (or not) to 4-OHT (1 μM) and that were serum starved (0.1% serum) for 72 hrs and subsequently released in 15% serum-containing media for the indicated times. In (E) and (F) 4-OHT was present throughout the entire experiment where indicated.
See also Figures S2, S3 and Table S1.

