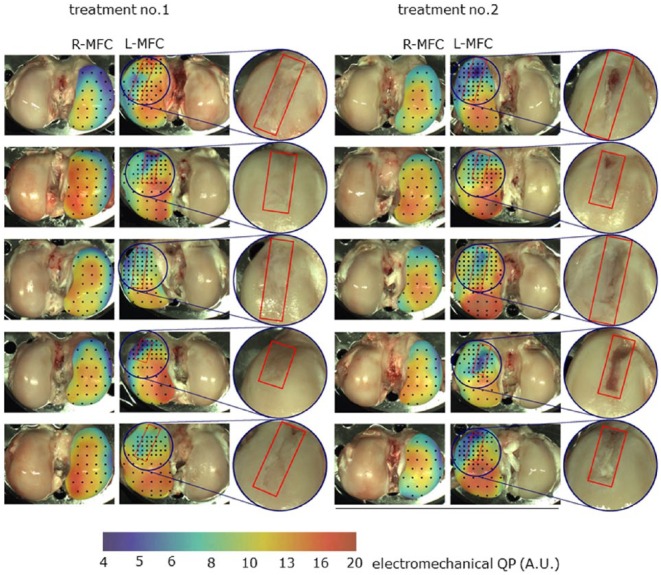
Figure 6.
Electromechanical QP mapping of R-MFC (untreated) and L-MFC (treated) of each sheep for both treatments. A logarithmic scale from 4 (blue, detection threshold) to 20 (red, max value in this study) was used. Sixty percent transparency was applied to the mapping layer so that articular surface landmarks remain visible through mapping. The associated scale was also blended with 60% transparency with the average cartilage surface color, which allows for a better matching of the scale colors to those of the mapping. The black dots represent all test positions performed. The repair site has been outlined in red on the treated L-MFC and has been zoomed in by 200%. L-MFC = left medial femoral condyle; R-MFC = right medial femoral condyle.

