. 2015 Apr 16;18(4):266–276. doi: 10.1111/ner.12292
© 2015 The Authors. Neuromodulation: Technology at the Neural Interface published by Wiley Periodicals, Inc. on behalf of International Neuromodulation Society.
This is an open access article under the terms of the Creative Commons Attribution‐NonCommercial‐NoDerivs License, which permits use and distribution in any medium, provided the original work is properly cited, the use is non‐commercial and no modifications or adaptations are made.
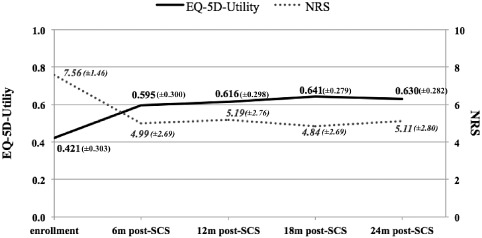
Figure 3.

NRS and EQ‐5D‐utility mean (±SD) values during the observational period.
