Figure 3.

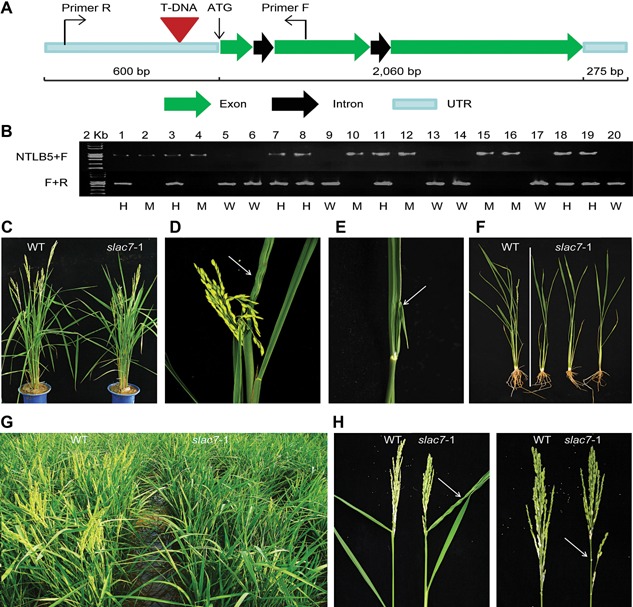
T‐DNA mutant screening (A) Location of T‐DNA insertion. (B) The polymerase chain reaction genotyping of slac7‐1 segregants in the T1 generation. All plants homozygous for T‐DNA insertion were positive for the band with NTLB5+F primers and negative with F+R primers, and had the developmental phenotypes of slac7‐1 (M). All wild‐type plants (W) for T‐DNA insertion were positive for the band with F+R primers and negative with NTLB5+F primers, and plants heterozygous for T‐DNA insertion were positive for both bands and had normal phenotypes. (C) slac7‐1 mutants were shorter than the wild type. (D) Crispation of leaves in slac7‐1 plants. (E) Leaf fusion in slac7‐1 plants. (F) Root length of slac7‐1 was shorter than that of wild‐type. (G) Heading stage of slac7‐1 was delayed by 7–9 d. (H) slac7‐1 panicle type.
