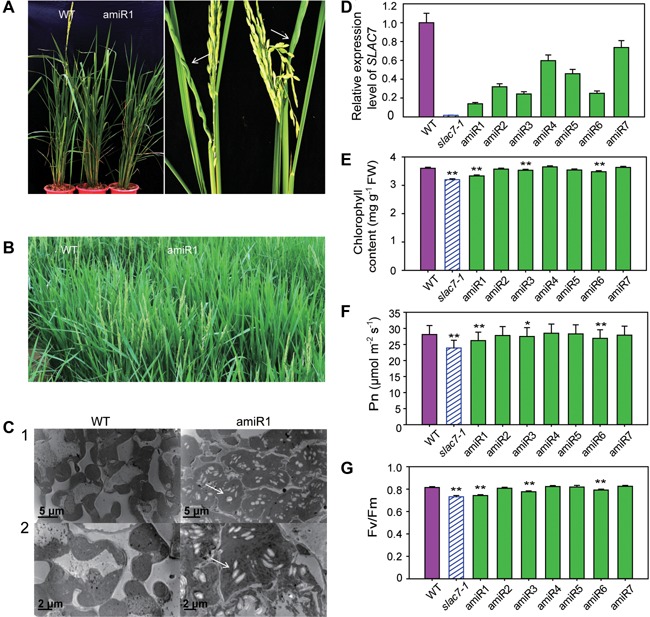
Figure 6.

Suppression of SLAC7 expression causes similar phenotypes as slac7‐1 (A) Leaf form and plant height of the amiR1 line plants showed similar phenotypes as slac7‐1. (B) Heading stage of the amiR1 line was delayed approximately 8–12 d compared with the wild type. (C) The development of the chloroplasts in amiR1 plants. White arrows indicate starch grains. 1 and 2 indicate two growth stages (seven leaf stage and 12 leaf stage). (D) Relative expression levels of SLAC7 in amiRNA transgenic plants. (E) Chlorophyll content in SLAC7 amiRNA transgenic plants. (F) Photosynthetic efficency of SLAC7 amiRNA transgenic plants. (G) Fv/Fm ratio of SLAC7 amiRNA transgenic plants. Data represent the mean values ± standard deviation of three independent experiments conducted with different 8 week old plants. Double asterisks denote a highly significant difference using Student's t‐test (P < 0.01), single asterisk denotes a significant difference using Student's t‐test (0.01 < P < 0.05).
