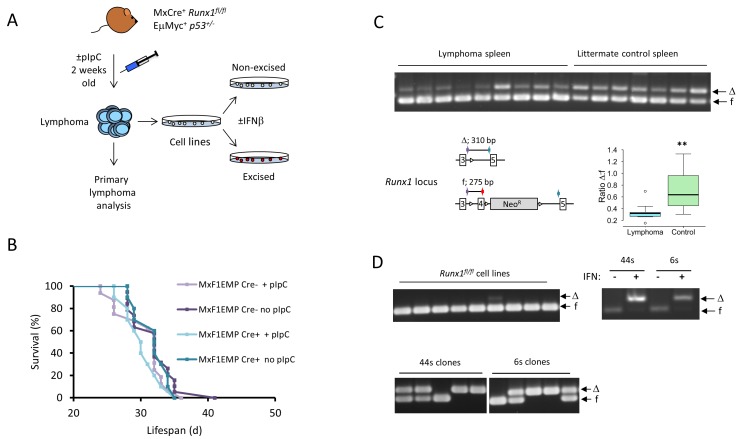
Figure 1. Eμ-Myc lymphomas strongly resist deletion of Runx1 in vivo but not in vitro.
A. Outline experimental design Lymphomas derived from Mx1Cre+/Runx1fl/fl/Eμ−Myc/p53+/− mice were analysed and also used to establish cell lines that could be treated in vitro with IFNβ to induce Runx1 excision. B. Survival curve for Runx1fl/fl/Eμ−Myc+/p53+/− mice with or without the Mx1Cre transgene and with or without pIpC treatment to excise Runx1. Statistical analysis by Wilcoxon Rank Sum test showed no significant difference in survival between the groups of mice. C. Upper panel : Runx1 excision PCR on genomic DNA derived from lymphoma spleen tissue of pIpC-treated Mx1Cre+/Runx1fl/fl/Eμ-Myc+/p53+/− mice (lymphoma spleen) and age-matched Eμ-Myc− (lymphoma-free) littermate controls (littermate control spleen). Arrows indicate Runx1-floxed (f) and Runx1-deleted (Δ) bands. The panel below left shows a diagram of the multiplex PCR for detection of deleted (Δ) and floxed (f) Runx1. The cartoon shows loxP sites flanking exon 4 in the floxed allele before and after excision, location of primers (colored arrows) and size of PCR products. The panel below right shows the ratio of excised:non-excised band intensity determined by densitometry for the Runx1 excision PCR samples shown in 1C. Boxplot shows the distribution of all the Δ:f ratios with the box representing the 1st to 3rd quantiles (Q1 to Q3) and the midline representing the median. Whiskers represent the smaller of the most extreme data point, or 1.5x the Q1-Q3 interquantile range. Asterisks denote statistical significance, with p = 0.008 D. The upper left panel shows Runx1 excision PCR on genomic DNA from a series of independent cell lines derived from Mx1Cre+/Runx1fl/fl/Eμ-Myc+/p53+/− lymphomas. The right panel shows Runx1 excision PCR on genomic DNA from samples of 44s and 6s Mx1Cre+/Runx1fl/fl/Eμ-Myc+/p53+/− cell lines treated with IFNβ to excise Runx1 or with vehicle control; cell samples were taken 2 days after the start of IFNβ treatment. The lower panel shows Runx1 excision PCR on genomic DNA from single cell clones derived from the 44s and 6s Mx1Cre+/Runx1fl/fl/Eμ-Myc+/p53+/− cell lines; cells were treated with a sub-optimal dose of IFNβ to induce partial excision of Runx1 and single cell cloned as detailed in Materials and Methods. Arrows indicate Runx1floxed (f) and Runx1-deleted (Δ) bands.

