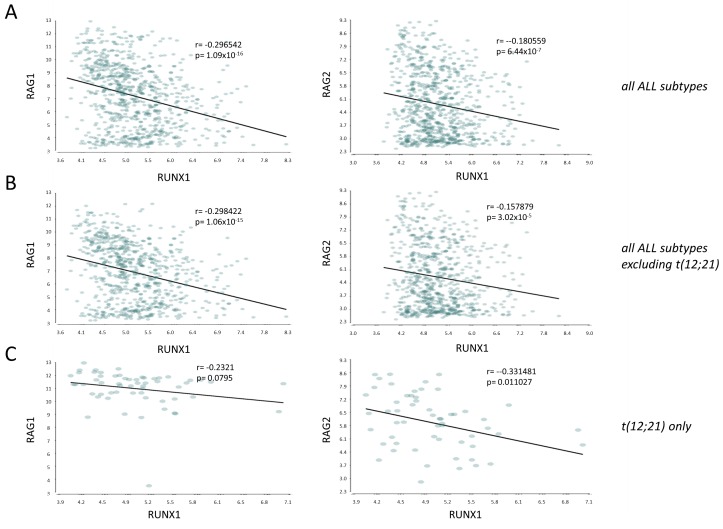
Figure 6. RUNX1 mRNA expression is negatively correlated with RAG1 and RAG2 in a large panel of human ALLs.
Pearson correlation plots of gene expression (probeset intensities) of RUNX1 vs RAG1 or RAG2 in A all ALL subtypes within the MILE database (ref [33]) (n = 750), B. all ALL subtypes with the exception of the t(12;21)/ETV6-RUNX1 subset (n = 692), C. the t(12;21) translocation only (n = 58). Plots show p-value and r-value.

