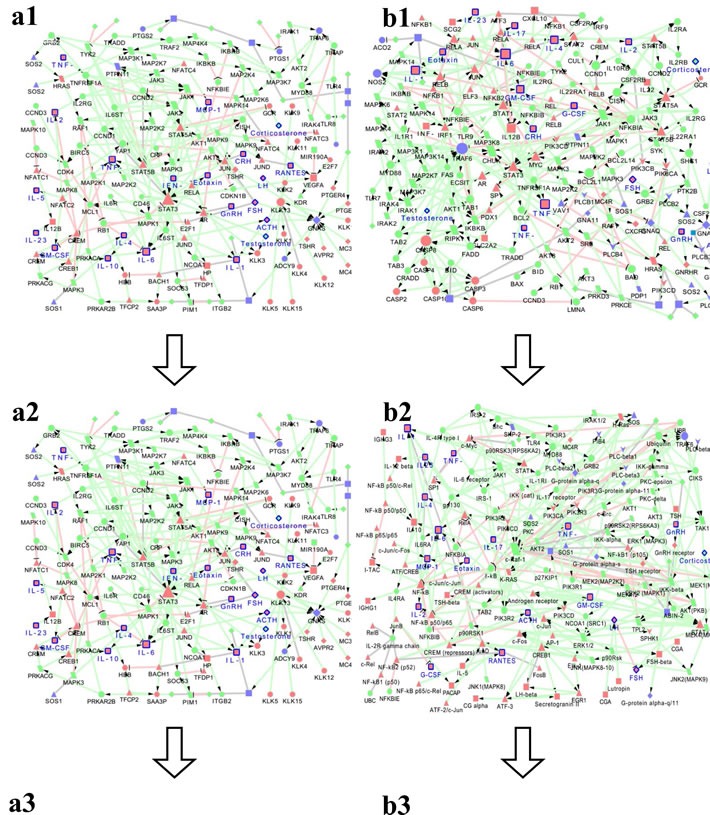
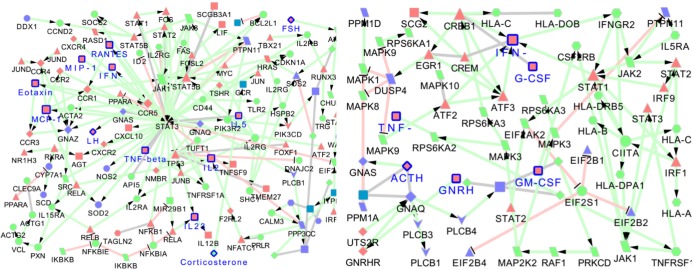
Figure 3. The MetaCore network of neuroendocrine immunomodulation in SAMP8 mice (a1) and PrP-hAβPPswe/PS1ΔE9 mice (b1), endocrine factors and cytokines correlated with cognitive impairments of SAMP8 mice and PrP-hAβPPswe/PS1ΔE9 mice analyzed by Pearson analysis (a2, b2) and multiple liner regression analyses (a3, b3).

The differentially expressed molecules in SAMP8 mice (CRH, ACTH, CORT, GnRH, FSH, LH, T, IL-1β, IL-2, IL-6, IL-23, GM-CSF, INF-γ, TNF-α, TNF-β, RANTES, eotaxin, MCP-1, IL-4, IL-5, IL-10, total 21 seeds) and PrP-hAβPPswe/PS1ΔE9 mice(CRH, ACTH, CORT, GnRH, FSH, LH, T, IL-1β, IL-2, IL-6, IL-23, IL-17, GM-CSF, TNF-α, TNF-β, eotaxin, IL-4, G-CSF, total 18 seeds), the molecules correlated with cognitive impairments of SAMP8 mice (CRH, ACTH, CORT, GnRH, FSH, LH, T, IL-1β, IL-2, IL-6, IL-23, GM-CSF, INF-γ, TNF-α, TNF-β, RANTES, eotaxin, MCP-1, IL-4, IL-5, IL-10, total 21 seeds) and PrP-hAβPPswe/PS1ΔE9 mice(ACTH, CORT, GnRH, FSH, LH, IL-1β, IL-2, IL-6, IL-23, IL-17, GM-CSF, INF-γ, TNF-α, TNF-β, eotaxin, MIP-1β, IL-4, G-CSF, total 18 seeds) analyzed by Pearson analysis, the molecules correlated with cognitive impairments of SAMP8 mice (CORT, FSH, LH, IL-2, IL-23, TNF-β, RANTES, eotaxin, MCP-1, RANTES, MIP-1β, IL-5 total 12 seeds) and PrP-hAβPPswe/PS1ΔE9 mice(ACTH, GnRH, GM-CSF, INF-γ, TNF-β, G-CSF, total 6 seeds) analyzed by multiple liner regression analyses in the present study were submitted to MetaCore (https://portal.genego.com). And obtained a comparatively complete molecular interaction network for SAMP8 mice and PrP-hAβPPswe/PS1ΔE9 mice by the visualization tool of Cytoscape. Nodes marked with blue border and label are differentially expressed molecules in SAMP8 mice and PrP-hAβPPswe/PS1ΔE9 mice we measured.  represent protein kinase,
  represent lipid kinase,
  represent protein phosphatase,
  represent regulators (GDI, GAP, GEF),
  represent GPCR,
  represent G-alpha,
  represent generic phospholipase,
  represent receptor ligand,
  represent generic protease,
  represent compound,
  represent transcription factor,
  represent generic enzyme,
  represent generic binding protein,
  represent reaction,
  represent generic receptor. The size of the node corresponds to the number of its indegree. The green line with black arrow indicates activation. The red line with black small line segments indicates inhibition. The gray line indicates there is undefined interaction between nodes.

