
Figure 3. ATGL down-regulation induces an antioxidant imbalance in skeletal muscle.
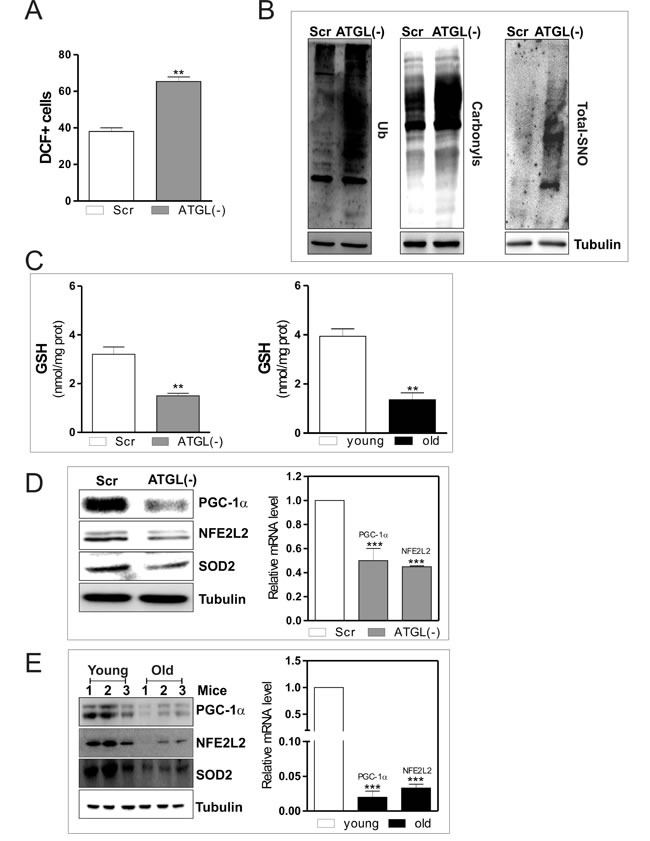
C2C12 cells were transfected with scramble (scr) or ATGL siRNA (ATGL(−)). A. Cells were assayed for ROS/ONOO- production by cytofluorimetric analysis after DCF-DA staining. ROS/ONOO- level was reported as percentage of DCF-positive cells and expressed as means ± S.D. (n = 4, **p < 0.001 vs. scr cells). B. Twenty μg of total proteins were used to detect ubiquitinated proteins by immunoblot with an anti-ubiquitin monoclonal antibody (left panel). Twenty μg of total proteins were derivatized with DNP and carbonylation was detected by Western blot with DNP antibody (middle panel). Total proteins extracts (500 μg) were subjected to S-NO derivatization with biotin. After Western blot, biotin adducts were identified by incubating nitrocellulose membrane with HRP-conjugate streptavidin (right panel). Tubulin was used as the loading control. C. GSH content of scr, ATGL(−) cells (left panel) and of three young and three old mice (right panel) was assayed by HPLC. Data are expressed as nmoles of GSH/mg of proteins and reported as means ± S.D. (n = 3, **p < 0.001 vs. scr cells or young mice). D.. scr and ATGL(−) cells were lysed and 20 μg of total proteins were subjected to Western blot analysis of PGC-1α, NFE2L2 and SOD2 (left panel). Tubulin was used as loading control. Total RNA was isolated from scr and ATGL(−) cells (right panel) and relative mRNA levels of PGC-1α and NFE2L2 were analyzed by RT-qPCR. Data are expressed as means ± S.D. (n = 4, ***p < 0.0001 vs. scr cells). E. Skeletal muscle of three young and three old mice was homogenized and 20 μg of total proteins were subjected to Western blot analysis of PGC-1α, NFE2L2 and SOD2 (left panel). Tubulin was used as loading control. All the immunoblots reported are from one experiment representative of four that gave similar results. Total RNA was isolated from skeletal muscle of three young and three old mice and relative mRNA levels of PGC-1α and NFE2L2 were analyzed by RT-qPCR. Data are expressed as means ± S.D. (n = 4, ***p < 0.0001 vs. young mice).