
Figure 4. Changes in SOD2 and γ-GCL gene expression upon ATGL decline in skeletal muscle.
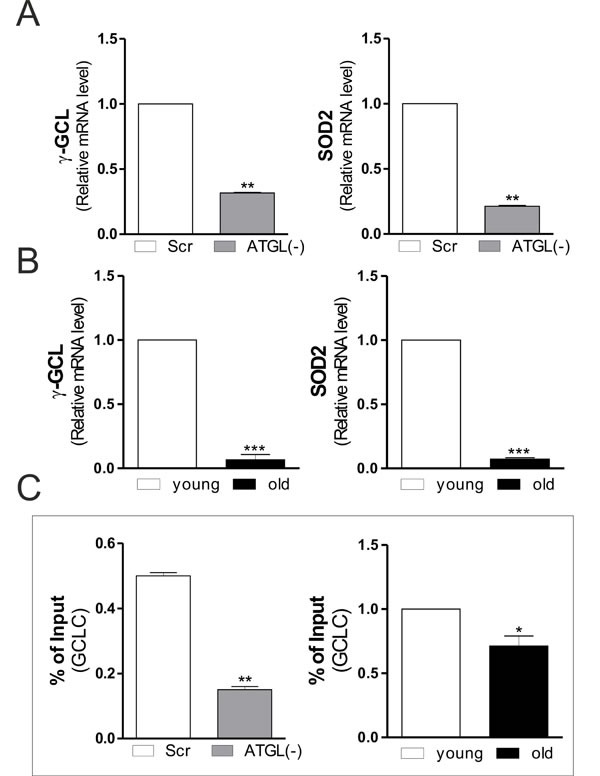
A., B. Total RNA was isolated from scr, ATGL(−) cells (upper panels) and skeletal muscle of three young and three old mice (bottom panels), and relative mRNA levels of γ-GCL and SOD2 were analyzed by RT-qPCR. Data are expressed as means ± S.D. (n = 3, **p < 0.001; ***p < 0.0001 vs. scr cells or young mice). C. ChIP assay was carried out on cross-linked nuclei from scr, ATGL(−) cells and skeletal muscle of three young and three old mice by using NFE2L2 antibody followed by qPCR analysis of ARE sequence on the GCLC promoter. Data are expressed as means ± S.D. (n = 3, **p < 0.001;*p < 0.01 vs. scr cells or young mice).