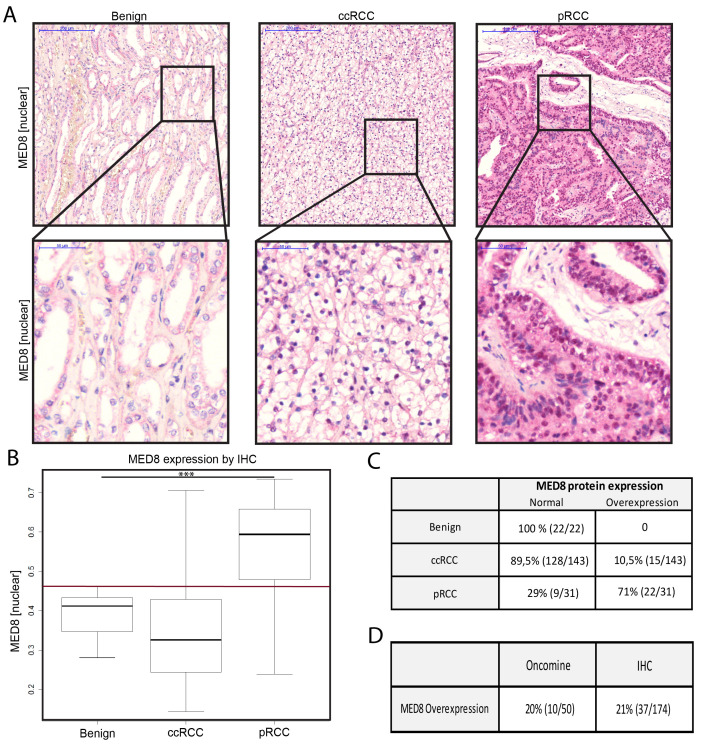
Figure 2. MED8 in RCC.
A. Representative IHC images from tissue of benign kidney, ccRCC and pRCC analysis of the MED8 protein expression with alkaline phosphatase as reporter dye (red), haematoxylin (blue) as counterstain. 5x (upper panel) and 40x (lower panel) objective magnification. B. MED8 protein expression profile of the total kidney cohort including benign tissue, ccRCC and pRCC. Boxplots of mean red chromogen intensity of the nucleus are shown. (Red reference line at y = 0.46 represents the cut-off for defining enhanced protein expression). C. Quantification of samples expressing MED8 in a normal and overexpressed range. D. Direct comparison between proportion of samples with a MED8 overexpression on mRNA (Oncomine) and protein level (IHC). (*** = p < 0.001, ccRCC = renal clear cell carcinoma, pRCC papillary renal cell carcinoma).

