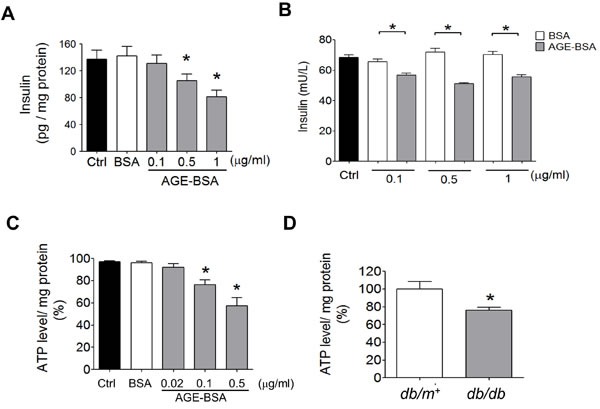
Figure 5. Effects of AGEs on insulin content and ATP production in β-cells.

RINm5f cells were treated with AGE-BSA and non-glycated BSA (0.02-1 μg/ml) for 24 hours. The cellular insulin content A. and insulin secretion in medium B. and cellular ATP content C. were measured. Data are presented as means ± SEM (n ≥ 5). *P < 0.05, versus BSA, #P < 0.05, versus pM51/AGE-BSA. In some experiments, the ATP levels in islets of db/db and db/m+ mice were detected D.. Data are presented as means ± SEM (n ≥ 10). *P < 0.05, versus db/m+ mice.
