
Figure 6. Involvement of AGEs-RAGE axis in the alterations of HSP60 protein expression, cell hypertrophy, ATP production, and insulin secretion in AGEs-treated β-cells.
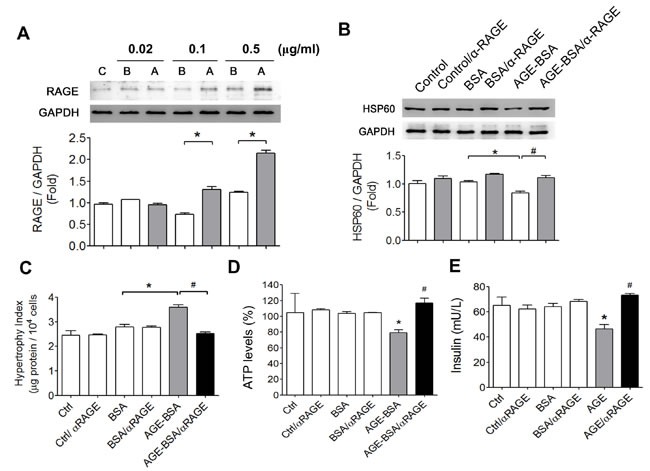
A. The effect of AGEs on RAGE protein expression in RINm5f cells. Cells were treated with AGE-BSA or non-glycated BSA (0.02-0.5 μg/ml) for 24 hours. The protein expression was determined by Western blotting. Protein levels were quantified by densitometry and normalized by GAPDH levels. Data are presented as means ± SEM (n ≥ 5). *P < 0.05, versus BSA. C: control, B: BSA, A: AGE-BSA. (B-E) After the pretreatment of RAGE neutralizing antibody (10 μg/ml) for 1 hour, RINm5f cells were treated with AGE-BSA or non-glycated BSA (0.5 μg/ml) for 24 hours. The protein expression of HSP60 B., cell hypertrophy index C., ATP content D., and insulin production E. were detected as described under “Materials and Methods”. Data are presented as means ± SEM (n = 4). *P < 0.05, versus BSA, #P < 0.05, versus AGE-BSA.