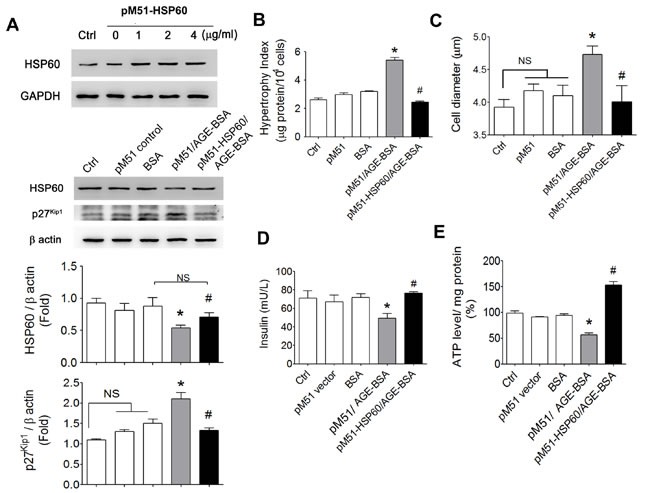
Figure 7. Effects of overexpressed HSP60 on cell hypertrophy and insulin secretion and ATP production in AGEs-treated β-cells.

RINm5f cells were transfected with pM51-HSP60 (0-4 μg/ml) for 48 hours. The pM51 empty vector was as a negative control. Transfection of pM51-HSP60 or pM51 vector control (1 μg/ml) for 48 hours, and then cells were treated with AGE-BSA and non-glycated BSA (0.5 μg/ml) for 24 hours. The protein expressions of HSP60 and p27Kip1 A., cell hypertrophy index B., cell diameter C., insulin secretion D., and ATP production E. were detected as described under “Materials and Methods”. Data are presented as means ± SEM (n ≥ 5). *P < 0.01, versus BSA, #P < 0.01, versus pM51/AGE-BSA. NS: non-significant.
