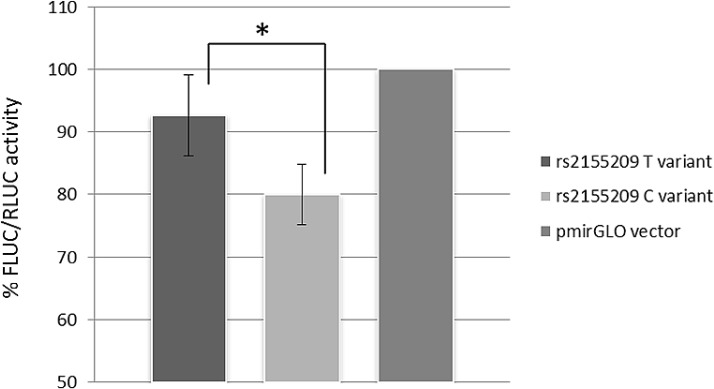
Figure 3. Data show mean values of luminescence activity, normalized to Renilla luciferase levels, (FLUC/RLUC) from four independent experiments.
MRE11A expression show a statistical significant (p = 0.007) decrease of about 14% in presence of the rs2155209 C-variant, compared to the expression obtained with the T-variant.

