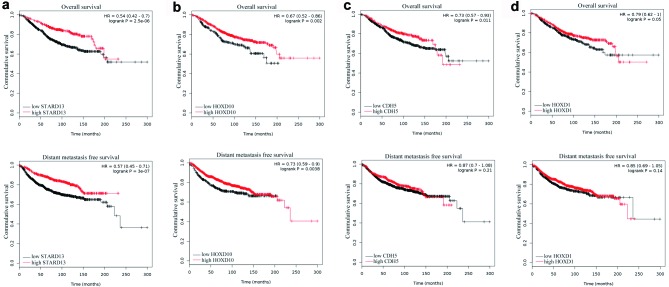
Figure 7. Correlation between the levels of STARD13 ceRNAs and the survival of breast cancer patients.
a.-d. KM survival curves based on analysis of a published microarray dataset from breast cancer patients showed OS and DMFS of patients separated into low and high STARD13 a., HOXD10 b., CDH5 c. and HOXD1 d. expression.

