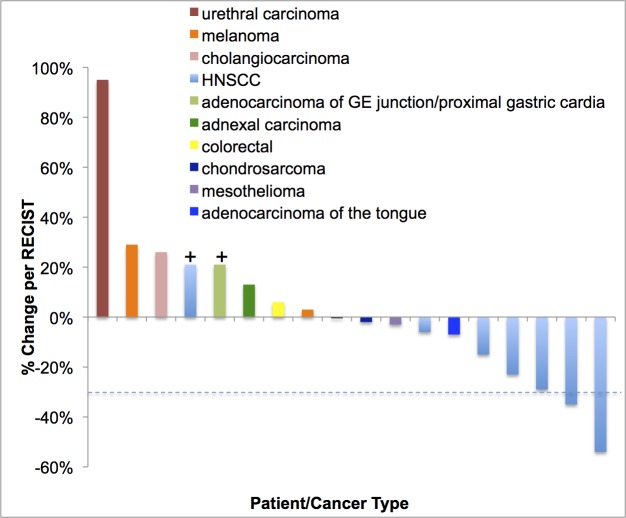
Figure 1. Waterfall plot depicting best RECIST response by patient.
Individual patients/disease sites are represented by vertical bars on the X-axis. The best RECIST response (%) is depicted on the Y-axis. Sixteen of the 21 patients were measurable by RECIST. Two patients were assigned a value of +21% for clinical progression or new lesions (+). Three patients are not included in this plot as they never reached restaging due to being taken off the study early in the first cycle for toxicity. Dotted line shows 30% response by RECIST.

