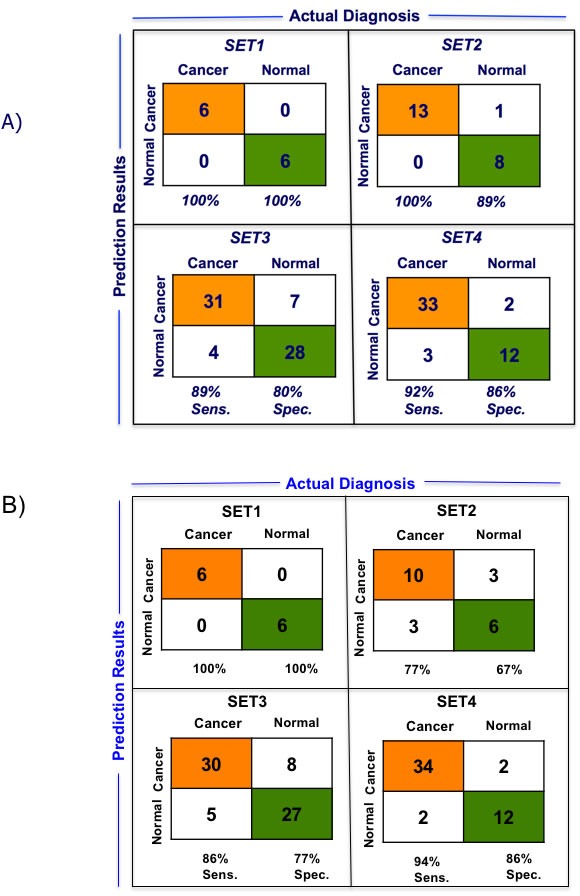
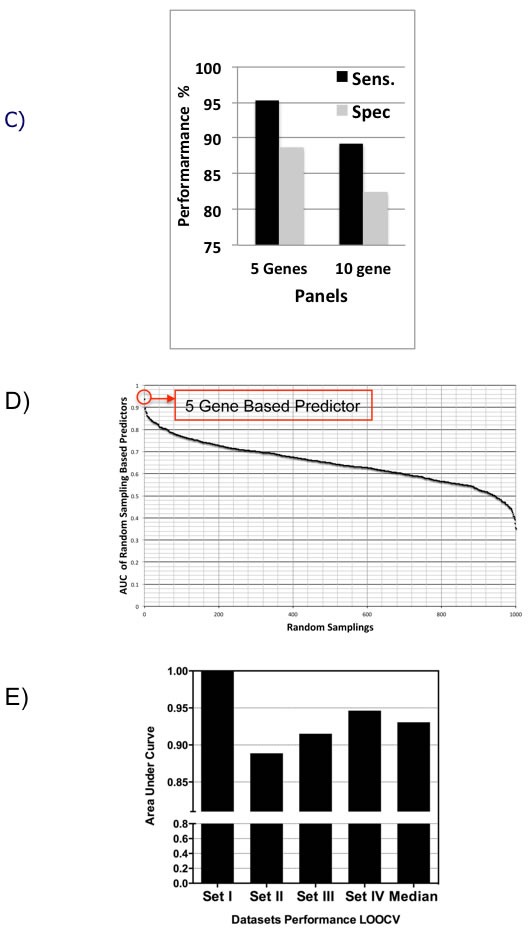
Figure 3. Performance of 5-gene and 10-gene PDAC Classifiers on training sets using leave one out cross-validation (LOOCV).


A. Diagnostic performance of the 5-gene PDAC classifier on the four training sets of PDAC vs. normal pancreas. Sensitivity (Sens.) and specificity (Spec.) are indicated below each set. B. Diagnostic performance of the 10-gene PDAC classifier on the four training sets of PDAC vs. normal pancreas. Sensitivity (Sens.) and specificity (Spec.) are indicated below each set. C. Comparison of the performance of the 5- and 10-gene PDAC classifiers across the four training sets. D. AUC curve for random sampling based prediction. The ranking of the 5-gene PDAC classifier is indicated. E. AUC plot for 5-gene PDAC classifier across the four training sets and for the median of the four datasets.
