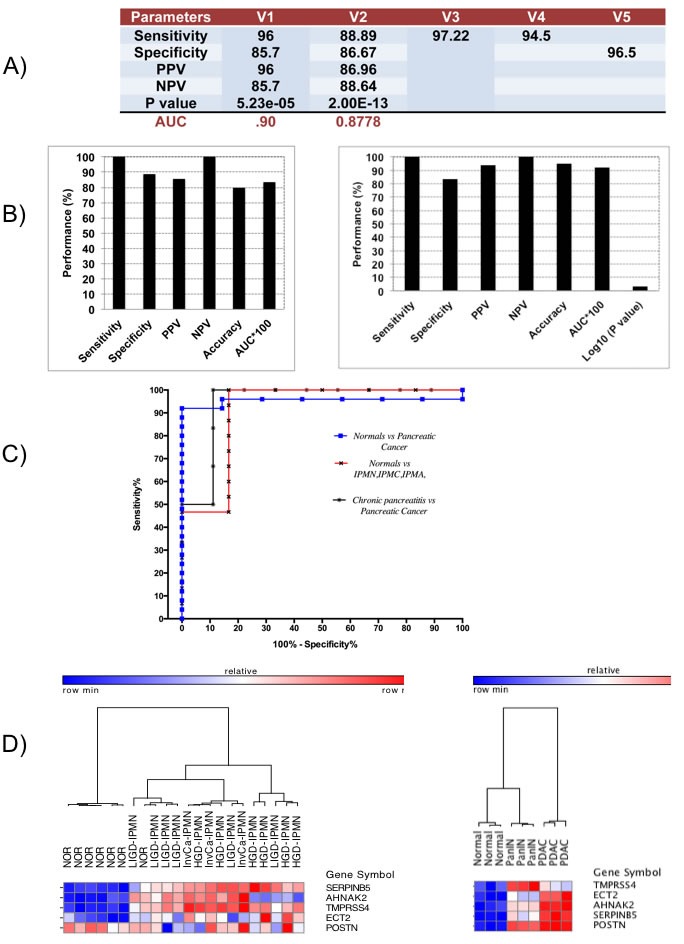
Figure 4. Performance and expression of 5-gene PDAC classifier on independent validation sets.

A. Diagnostic performance of 5-gene PDAC classifier on five independent validation sets of normal and PDAC tissue samples. PPV = positive predictive value, NPV = negative predictive value. B. Diagnostic performance of the 5-gene PDAC classifier on Pancreatitis vs. Pancreatic Cancer dataset (Left) and on a dataset of normal pancreatic duct compared to LIGD-IPMN, HGD-IPMN, and InvCa-IPMN (Right). C. ROC curves for the different independent validation datasets. D. Hierarchical clustering analysis showing performance and expression of the 5-gene PDAC classifier on normal pancreatic duct compared to LIGD-IPMN, HGD-IPMN, and InvCa-IPMN samples. Red = upregulated, Blue = downregulated (Left Heatmap). Cross-species performance of the 5-gene PDAC classifier on a GEM mouse model of PDAC (Right Heatmap). Hierarchical clustering of pancreatic tissue samples from three mice each for normal pancreas, PanIN and PDAC across the 5-gene PDAC panel. Red = upregulated, Blue = downregulated.
