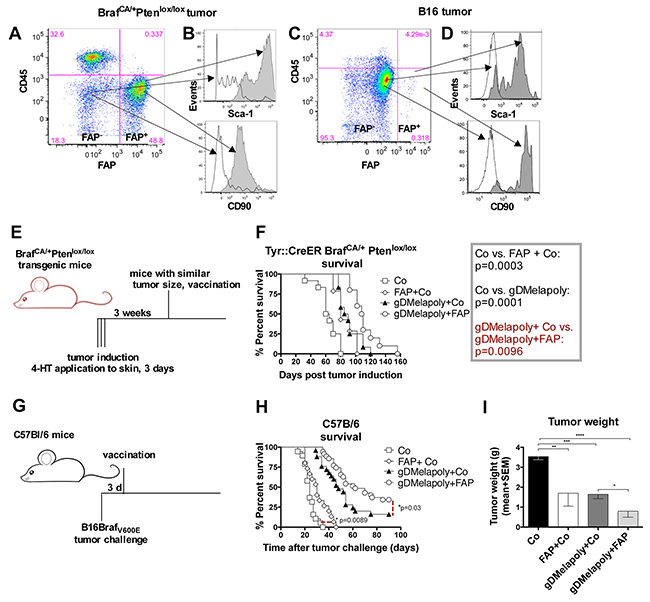
Figure 2. Vaccination with the AdC68-mFAP vector improves survival of tumor-bearing mice.

A, C. Representative flow plot shows the presence of CD45−FAP+cells within tumors from BrafCA/+Ptenlox/lox transgenic mice (A) or within B16 tumors (C). B, D. Histograms indicate the expression of mesenchymal stroma cell markers CD90 and Sca-1 on CD45−FAP+ (dark grey) and CD45−FAP− cells (white) in tumors from transgenic mice (B) or in B16 tumors (D). E. Schematic representation of experimental set up to test vaccine efficacy in transgenic mice. Tumors were induced in transgenic mice by 4-HT treatment for 3 consecutive days. Mice were vaccinated with different vectors 3 weeks after tumor induction. F. Graph shows Kaplan-Meier survival curves of mice that received the different vaccine regimens (n=10-14/group). Open square: control group (AdC68-gD vector); Diamond: control+AdC68-mFAP vaccine group; Black triangle: AdC68-gDMelapoly+ AdC68-gD vaccine group; Circle: AdC68-gDMelapoly+ AdC68-mFAP vaccine group. AdC68-gD vs. FAP+ AdC68-gD: p=0.0003; AdC68-gD vs. gDMelapoly+control: p=0.0001; gDMelapoly+ AdC68-gD vs. gDMelapoly+FAP: p=0.0096. G. Schematic representation of experimental set up to test vaccine efficacy in mice bearing transplantable B16 tumors. C57BL/6 mice were challenged with B16 tumor cells and vaccinated three days later with different vectors. H. Graph shows Kaplan-Meier survival curves of mice that received the different vaccine regimens (n=15-35/group). Symbols representing each vaccine group are the same as those used in 2F. Control vs. FAP+control: p=0.0089; gDMelapoly+ AdC68-gD vs. gDMelapoly+FAP: p=0.03. I. Tumor weight comparisons among different vaccine groups on day 25 after B16 tumor challenge. Data are presented as mean with SEM. AdC68-gD vs. FAP+ AdC68-gD: p=0.014; AdC68-gD vs. gDMelapoly+AdC68-gD: p=0.0001; AdC68-gD vs. gDMelapoly+FAP: p<0.0001; gDMelapoly+AdC68-gD vs. gDMelapoly+FAP: p=0.03.
