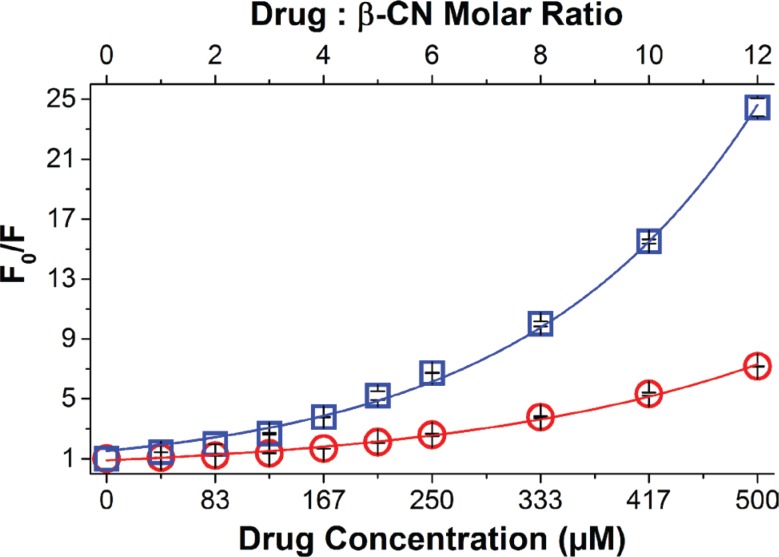
Figure 1. Drug-β-CN binding studies.
Modified Stern-Volmer plots for β-CN Trp143 fluorescence quenching by PTX (○) and TQD (□) as a function of drug:β-CN molar ratio (top axis) and drug concentration (bottom axis). Excitation: 270 nm and Emission: 356 nm. Lines represent model fits; error bars represent standard error (SE).

