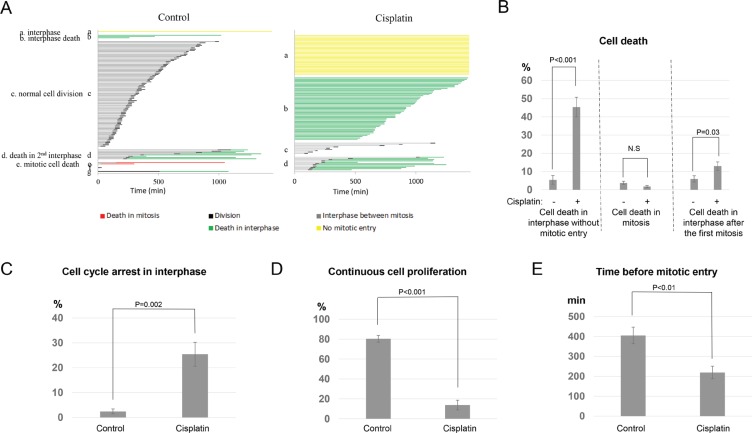
Figure 1. Diverse cell fate choices in resistant cancer cells treated with cisplatin.
(A) As described in Materials and Methods, cell fate profiles of UM-SCC-38 cells treated with or without cisplatin were quantified. A representative experiment is shown. Each horizontal line represents one cell, with the length of the line corresponding to the duration of a given behavior. The color of the line represents a specific cell behavior as indicated. The y-axis is organized to reflect various cell fates: a. interphase (without mitotic entry); b. interphase cell death; c. normal cell division; d. cell death in the 2nd interphase; e. mitotic cell death. (B) The induction of cell death by cisplatin in UM-SCC-38 cells. The percentages of cells underwent interphase cell death without mitotic entry, death in mitosis, or death in the subsequent interphase following the first mitosis are shown. UM-SCC-38 cells without cisplatin treatment were included as a control. In all panels, the mean values and standard errors were calculated from multiple independent experiments, as described in Materials and Methods. P-value > 0.05 is considered non-significant (N.S). (C) UM-SCC-38 cells were treated with or without cisplatin as indicated. The percentages of cells that were arrested in interphase are shown. (D) UM-SCC-38 cells were treated with or without cisplatin as indicated. The percentages of cells that exhibited continued cell proliferation are shown. (E) The length of interphase (in minutes) prior to mitotic entry is shown in the control and cisplatin-treated UM-SCC-38 cells.

