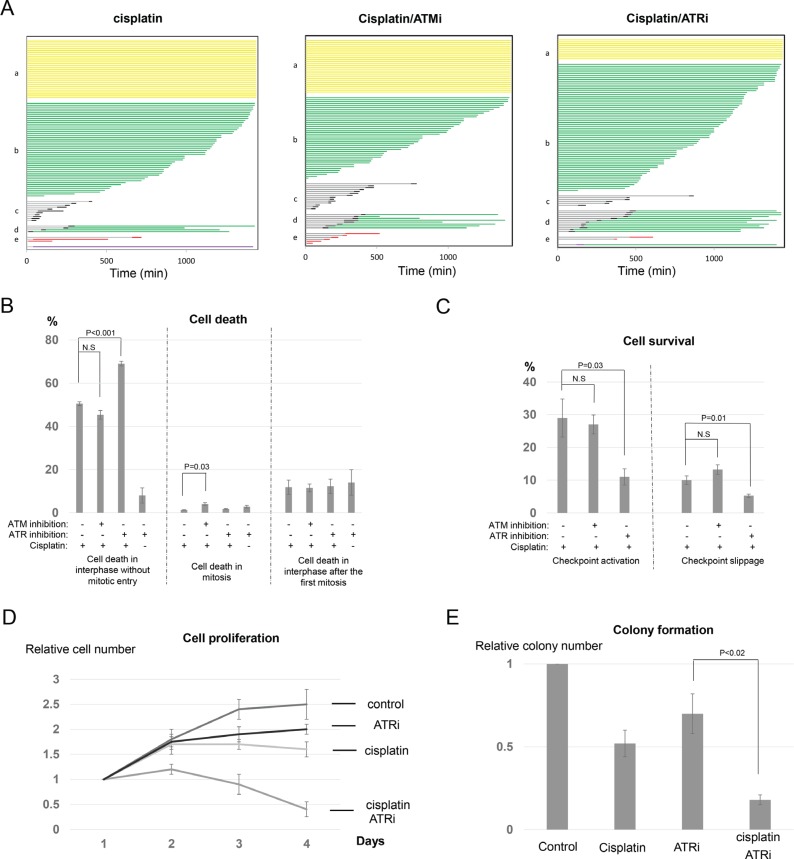
Figure 6. Inhibition of ATR, but not ATM, sensitizes cisplatin treatment.
(A) UM-SCC-38 cells were treated with cisplatin and ATM/ATR inhibitors as indicated. Cell fate profiles were quantified, and a representative experiment is shown. Each horizontal line represents one cell, with the length of the line corresponding to the duration of a given behavior. The color of the line represents a specific cell behavior as indicated. The y-axis is organized to reflect various cell fates: a. interphase; b. interphase death; c. normal cell division; d. death in 2nd interphase; e. mitotic cell death. (B) UM-SCC-38 cells were treated with cisplatin and ATM/ATR inhibitors as indicated. The percentages of UM-SCC-38 cells underwent interphase cell death without mitotic entry, death in mitosis, or death in the subsequent interphase following the first mitosis are shown. (C) UM-SCC-38 cells were treated with cisplatin and ATM/ATR inhibitors as indicated. The percentages of UM-SCC-38 cells that survived the treatment via checkpoint activation and checkpoint slippage are shown. (D) UM- SCC-38 cells were untreated (control), treated with cisplatin only, ATR inhibitor only, or cisplatin and ATR inhibitor over a period of 4 days. Cell number in each group was measured as described in Materials and Methods. The relative cell number (actual cell number/the starting cell number in day 1) is shown. (E) Clonogenic assay was performed as described in Materials and Methods. UM-SCC-38 cells were untreated (control), treated with cisplatin only, ATR inhibitor only, or cisplatin combined with ATR inhibitor. In all panels, the mean values and standard errors were calculated from multiple independent experiments, as described in Materials and Methods. P-value > 0.05 is considered non-significant (N.S).

