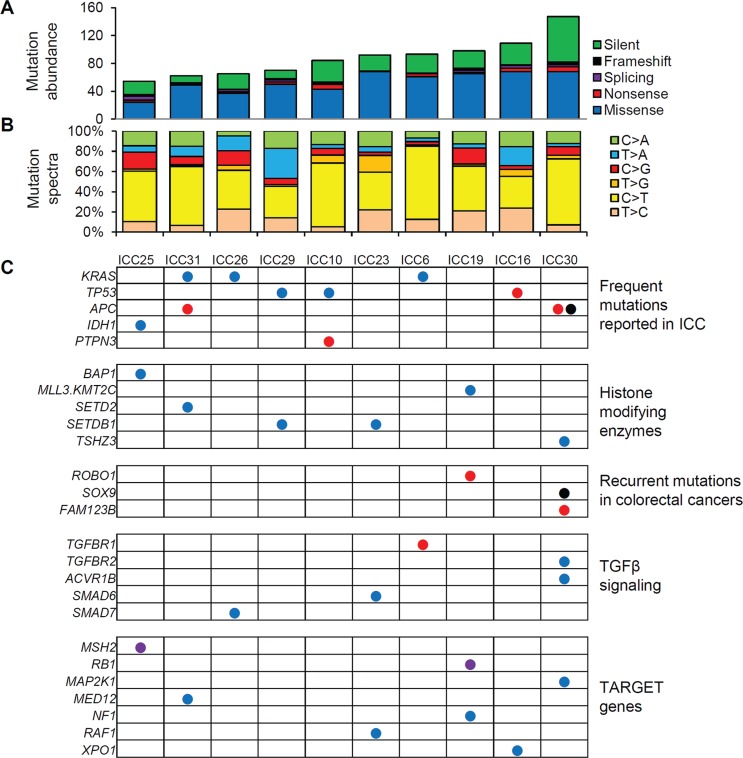
Figure 1. WES-based somatic mutation landscape of ICC.
(A) Ten ICC genomes are sorted in order of the mutational abundance. Somatic mutations are classified into five functional categories as reported by ANNOVAR with respective colors. (B) The six mutation spectra are shown with the dominance of C:G to T:A transitions in ICC genomes. (C) Nonsilent mutations on cancer-related genes are illustrated. The genes are categorized into five major categories. As cancer-related genes not previously reported to be recurrent in ICC, we used TARGET (tumor alterations relevant for genomics-driven therapy) database. Blue, red, purple, and black circles represent missense, nonsense, splicing mutations and frameshift indels, respectively.

