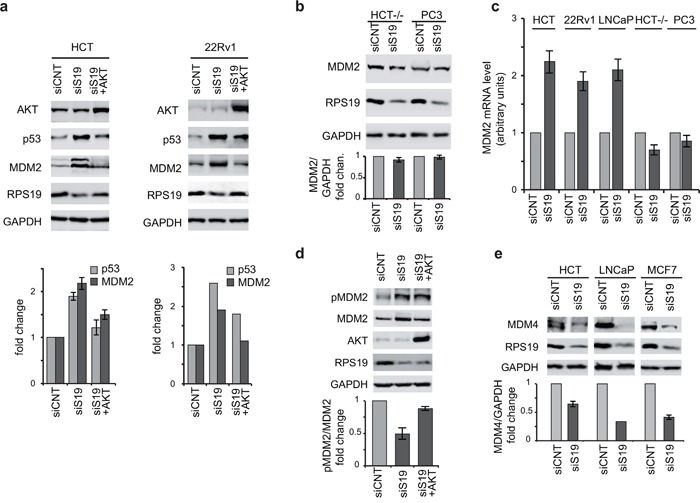
Figure 4. AKT regulate p53 and MDM2.

Total protein extracts were analyzed by western blot with indicated primary antibodies. Quantification of the signal was carried out as in Figure 2. a. Extracts from HCT116 and 22Rv1 cells transfected with control siRNA (siCNT), with RPS19-specific siRNA (siS19), or with RPS19-specific siRNA plus AKT expressing plasmid (siS19+AKT). Quantification in 22Rv1 cells is from two independent experiment. b. Extracts from HCT−/− and PC3 cells transfected with control siRNA (siCNT) or with RPS19-specific siRNA (siS19). c. Total RNA was extracted from HCT116, 22Rv1, LNCaP, HCT−/− and PC3 cells transfected with control siRNA (siCNT) or with RPS19-specific siRNA (siS19) and analyzed by qRT-PCR with primers specific for MDM2 and GAPDH. The results of triplicate RT–qPCR from three independent RNA preparations are reported as a column plot of the mean±s.e.m. of MDM2 mRNA normalized by GAPDH mRNA. d. Extracts from HCT116 cells transfected with control siRNA (siCNT), with RPS19-specific siRNA (siS19) or with RPS19-specific siRNA plus AKT expressing plasmid (siS19+AKT). e. Extracts from HCT116, LNCaP and MCF7 cells transfected with control siRNA (siCNT) or with RPS19-specific siRNA (siS19).
