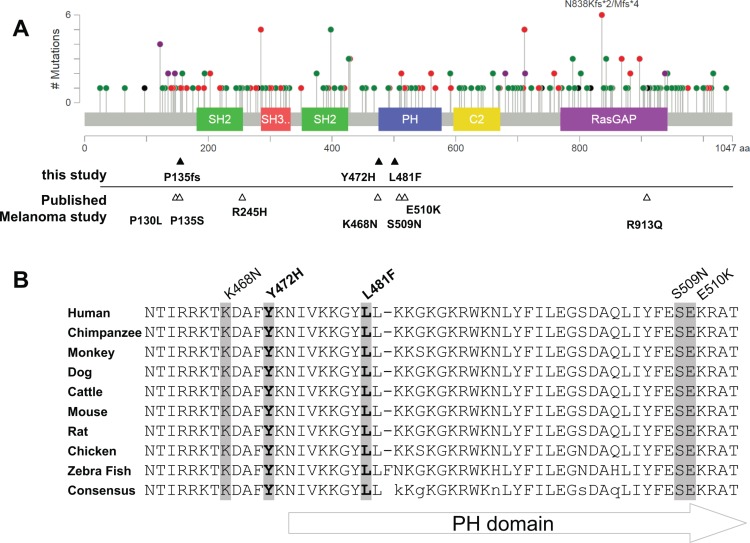
Figure 1. Mutation distribution in RASA1.
(A) A schematic of human RASA1 showing the distribution of the mutations identified in all cancer types (adapted from cBioPortal) with conserved protein functional domains: SH2, PH, SH3, C2, and RasGAP domains. Green: missense mutation; Red: nonsense, frame shift, and splice site mutation; Black: in frame deletion; and Purple: combination of Red and Green mutations. Note some recurrent alterations. Mutations identified in melanomas are marked under the graph (filled triangles: this study, empty triangles: published melanoma studies). (B) Alignment of RASA1 sequence around the PH domain among different species. Five out of ten mutations identified in melanomas are localized within this highly conserved region (< 50 amino acids).

