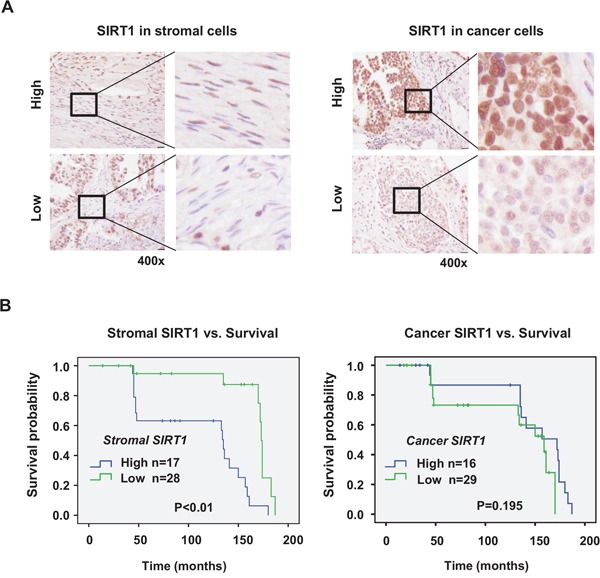
Figure 2. Survival analysis of ovarian cancer patients.

SIRT1 expression was immunohistochemically analyzed in cancer cells and stromal cells of each specimen in human ovarian cancer tissue microarray. Representative images (400x magnification) of immunostained SIRT1 in stromal fibroblasts and cancer cells of human ovarian cancer tissues are presented in the panel A. The scale bar represents 20 μm. Quantification of protein expression by estimation of staining intensity was described in Materials and Methods. B. Kaplan–Meier curves were plotted to estimate overall survival of patients with cancer according to the expression of SIRT1. Significant association of SIRT1 expression with overall survival was analyzed by comparing differences between curves using the log-rank test.
