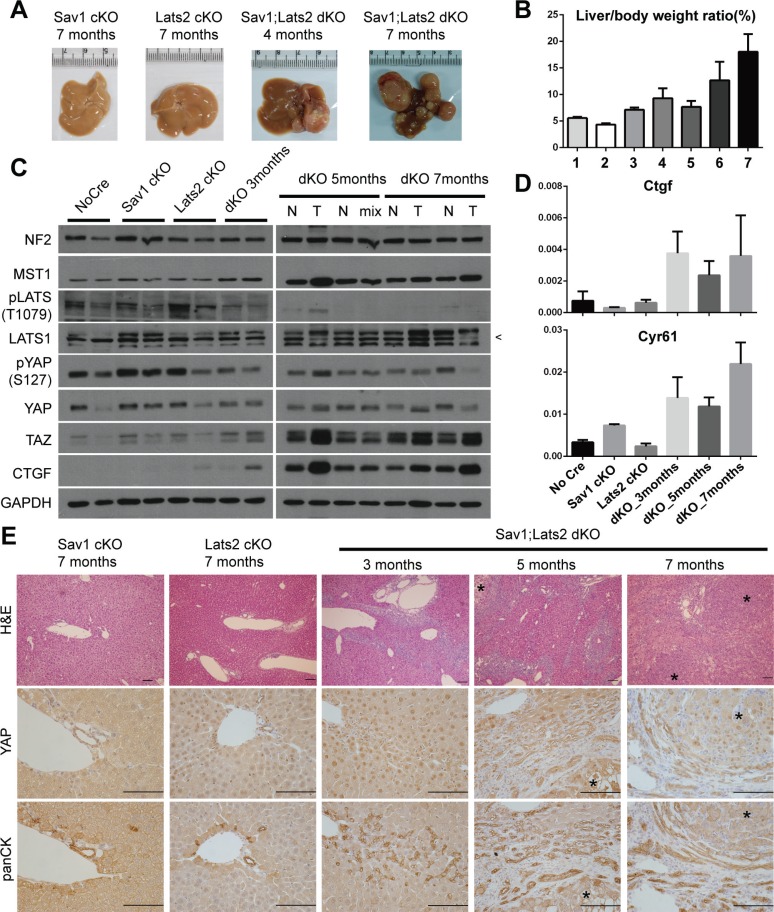
Figure 3. Ablation of negative feedback on YAP accelerates the YAP activity-induced mouse liver phenotype.
(A) Representative images of livers from mice with liver-specific knockout of the indicated genes at the indicated ages. (B) Weight ratio of the liver to the whole body of mice. Genotypes and ages of each bar are as follow; bar1-Sav1 cKO 7 months, bar2-Lats2 cKO 7 months, bar 3 to 7-Sav1;Lats2 dKO of 3, 4, 5, 6 and 7 months. (n ≥ 3 for each). (C) Hippo pathway components in liver tissues from each mouse of the indicated genotype and age were examined by Western blot analysis. N, normal tissue; T, tumor node; Mix, mix of normal and tumor tissue portions (necessitated by small node size). Pointer at right in LATS1 blot indicates the correct band. (D) mRNA levels of the YAP target genes Ctgf and Cyr61 relative to Gapdh in liver tissues from the indicated genotypes and ages (n ≥ 3 for each). (E) Representative liver sections of mice with liver-specific knockout of the indicated genes at the indicated ages showing H & E staining and immunohistochemistry for YAP and cytokeratins. Asterisks in sections denote tumor nodes. Scale bars: 200 μm.

