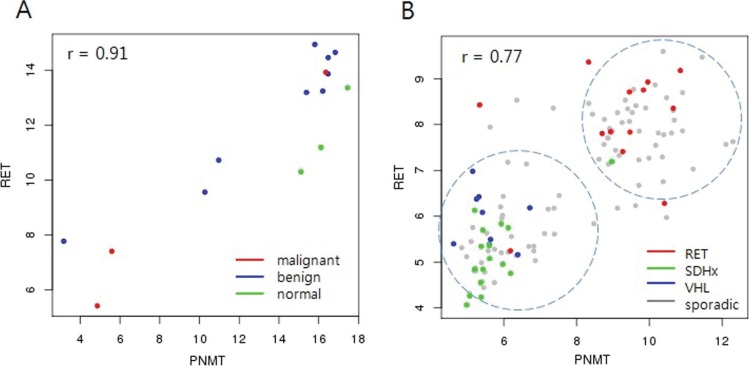
Figure 4. Correlation between PNMT and RET.
RET showed the highest correlation (r = 0.91) with PNMT in our data (A) Malignant tumors showed low expression of both PNMT and RET. RET showed the highest correlation (r = 0.77) with PNMT in the GSE19987 dataset, which includes hereditary PCC/PGL (B) Tumors harboring RET germline mutations showed high PNMT and RET expression, while SDHx/VHL germline-mutated tumors showed low expression.

