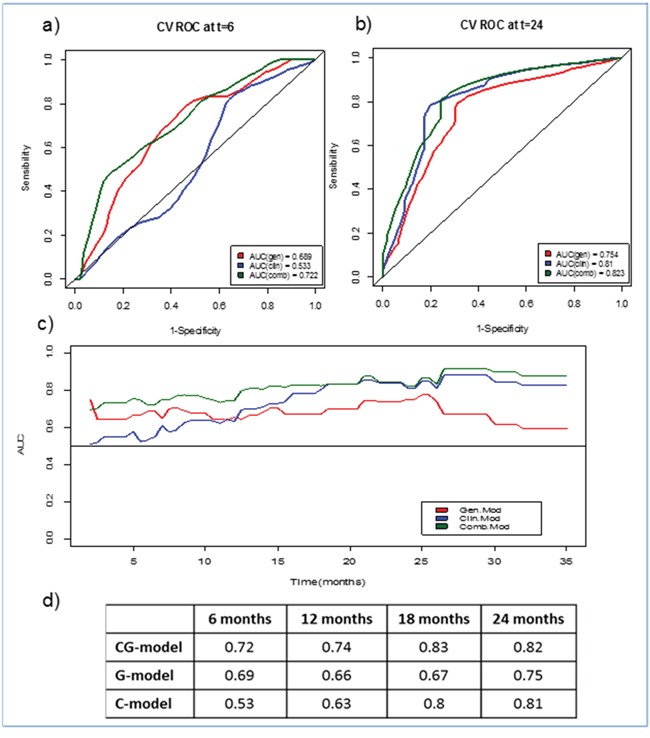
Figure 2. Time-dependent ROC curves for the three models (GC, G and C).

a. At 6 months, b. At 24 months, c. AUC evolution for each model over time, d. AUC values for each model at four specific time points

a. At 6 months, b. At 24 months, c. AUC evolution for each model over time, d. AUC values for each model at four specific time points