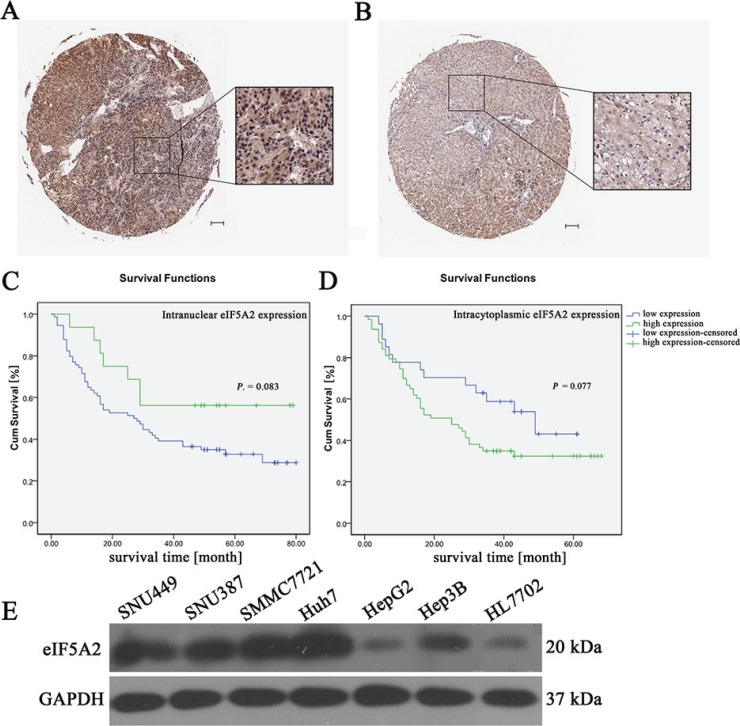
Figure 2. The relationship between eIF5A2 expression and overall survival.
(A and B) Representative immunohistochemical images showing the overexpression of eIF5A2 in HCC tissue (A) and its expression in adjacent tissue (B) (scale bars, 100 μm). (C) Kaplan-Meier curves for overall survival time in 90 HCC patients plotted according to their intranuclear expressions of eIF5A2; P = 0.083 by the log-rank test. (D) Kaplan-Meier curves for overall survival rates of 90 HCC patients based on the intracytoplasmic expression of eIF5A2; P = 0.077 by the log-rank test. (E) Western hybridization reflecting the expression of eIF5A2 in six HCC cell lines and normal human liver cells (HL7702).

