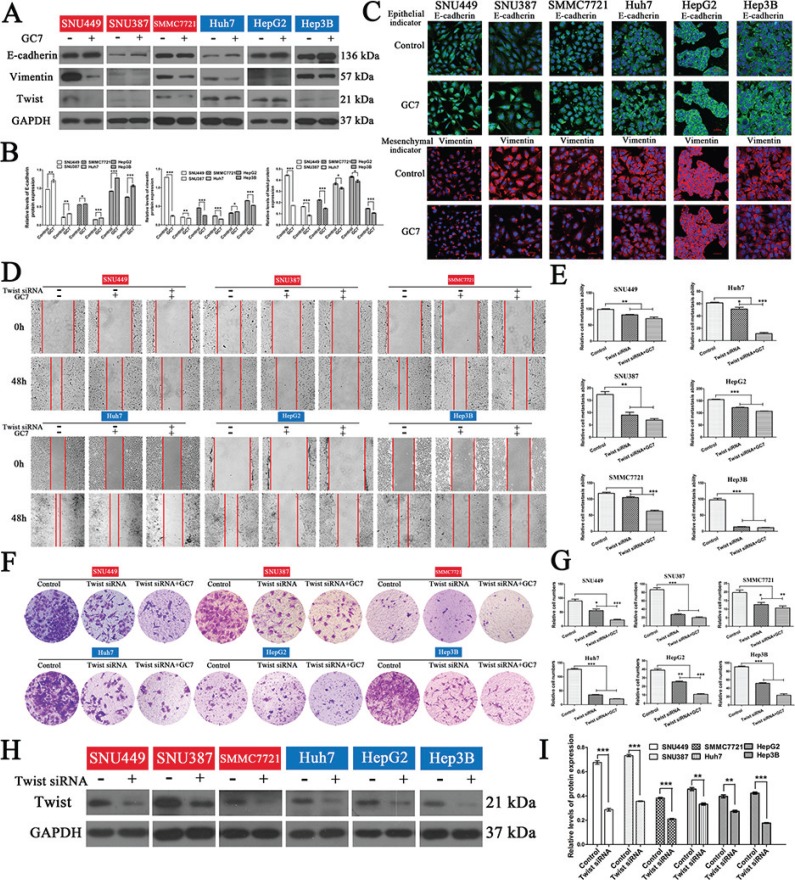
Figure 5. GC7 altered EMT progress and did not inhibit the invasion and migration of HCC cells after blocking the EMT.
(A) Expression of E-cadherin, vimentin, and twist in cells were cultured in the presence or absence of GC7 (50 μM) for 24 h. GAPDH served as a loading control. (B) Bar graphs based on quantitative data from (A). Data are mean ± SEM. *P < 0.05, **P < 0.01,***P < 0.001 versus control. (C) Immunofluorescence staining for E-cadherin (green), an epithelial marker, and vimentin (red), a mesenchymal marker, in six HCC cell lines cultured in the presence or absence of GC7 for 24 h. Nuclei were counterstained with DAPI. Scale bars, 50 μm. (D) Representative photographs of wound-healing assays at 0 and 48 h after creating a wound (magnification 100 ×). Cells were divided into three groups: control, GC7, and GC7 plus twist siRNA transfection. (E) Bar graphs based on quantitative data from (D). Data are mean ± SEM. *P < 0.05, **P < 0.01,***P < 0.001 versus control. (F) Representative photographs of crystal violet-stained cells after twist siRNA transfection in the presence or absence of GC7 for 48 h in transwell experiments (magnification 100 ×). (G) Bar graphs based on quantitative data from (F). Data are mean ± SEM. *P < 0.05, **P < 0.01,***P < 0.001 versus control. (H) Western hybridization confirmed the effect of twist siRNA transfection. (I) Bar graphs based on quantitative data from (H). Data are mean ± SEM. *P < 0.05, **P < 0.01,***P < 0.001 versus control. Each experiment was repeated at least three times.

