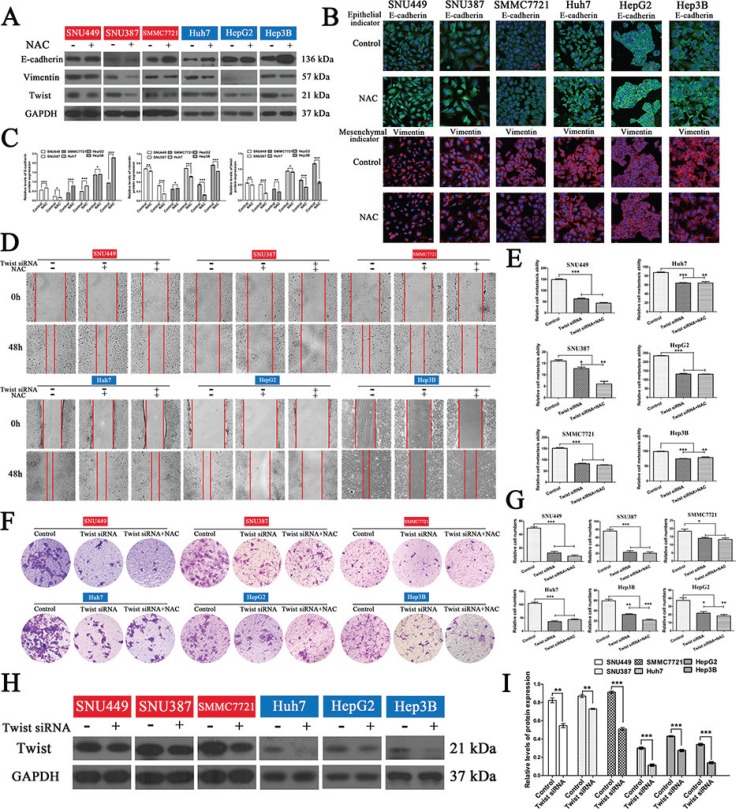
Figure 6. NAC reversed the EMT in HCC cells and the inhibitory effects on invasion and migration of HCC cells were reduced after blocking the EMT.
(A) Western blotting and (B) inverted confocal microscopic images (scale bars, 50 μm) showing the expression of E-cadherin (epithelial marker: green) and vimentin (mesenchymal marker: red) in HCC cells. Nuclei were counterstained with DAPI. (C) Bar graphs based on quantitative data from (A). Data are mean ± SEM. *P < 0.05, **P < 0.01,***P < 0.001 versus control. (D) Wound-closure control, NAC, and NAC plus twist siRNA transfection groups. Representative photographs at 0 and 48 h after creating a wound (magnification 100 ×). (E) Bar graphs based on quantitative data from (D). Data are mean ± SEM. *P < 0.05, **P < 0.01, ***P < 0.001 versus control. (F) Transwell chambers were used to determine the invasion of cells after twist siRNA transfection in the presence or absence of NAC for 48 h (representative photographs, magnification 100 ×). (G) Bar graphs based on quantitative data from (F). Data are mean ± SEM. *P < 0.05, **P < 0.01,***P < 0.001 versus control. (H) Western hybridization confirmed the effect of twist siRNA transfection. (I) Bar graphs based on quantitative data from (H). Data are mean ± SEM. *P < 0.05, **P < 0.01,***P < 0.001 versus control. Each experiment was repeated at least three times.

