
Figure 4. The phosphorylation of TOPK at Y74 and Y272 by Src promotes carcinogenesis ex vivo.
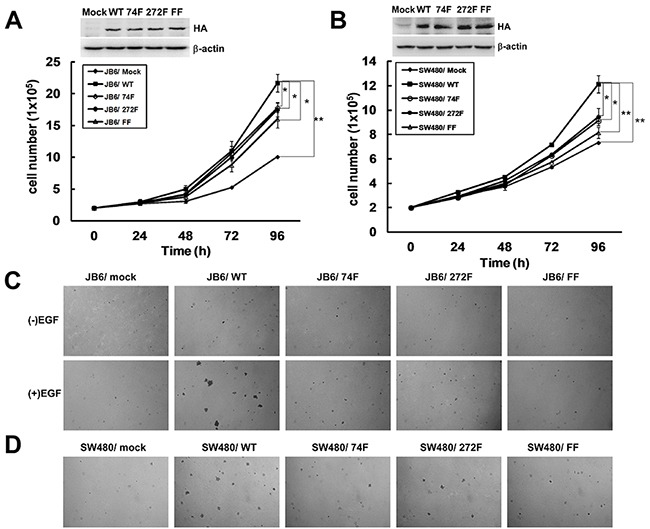
A. Growth curves of JB6 cells stably expressing pcDNA3-Mock (JB6/ Mock), pcDNA3-TOPK-WT (JB6/ WT), pcDNA3-TOPK-74F (JB6/ 74F), pcDNA3-TOPK-272F (JB6/ 272F), or double-mutant pcDNA3-TOPK-FF (JB6/ FF). Inset (top) showed verification of the cell lines identified by Western blot. Data are represented as means±SD of triplicate experiments. *, significantly (P < 0.05) decrease in cell number in JB6/ 74F, JB6/ 272F or JB6/ FF cells compared with JB6/ WT cells respectively. **, significantly (P < 0.01) increase in cell number in JB6/ WT cells compared with JB6/ Mock cells. B. Growth curves of SW480 cells stably expressing pcDNA3-mock (SW480/ Mock), pcDNA3-TOPK-WT (SW480/ WT), pcDNA3-TOPK-74F (SW480/ 74F), pcDNA3-TOPK-272F (SW480/ 272F), or double-mutant pcDNA3-TOPK-FF (SW480/ FF). Inset (top) showed verification of the cell lines identified by Western blot. Data are represented as means±SD of triplicate experiments. *, respective (P < 0.05) decrease in cell number in SW480/ 74F or 272F compared with SW480/ WT cells. **, significantly (P < 0.01) decrease in cell number in SW480/ FF cells compared with SW480/ WT cells and significantly (P < 0.01) increase in cell number in SW480/ WT cells compared with SW480/ Mock cells. C. Transfectants of JB6/ Mock, WT, 74F, 272F, or FF were compared for EGF-induced colony formation in soft agar. D. Transfectants of SW480/ Mock, WT, 74F, 272F, or FF were compared for colony formation in soft agar.