
Figure 6. FADD interference induces autophagy.
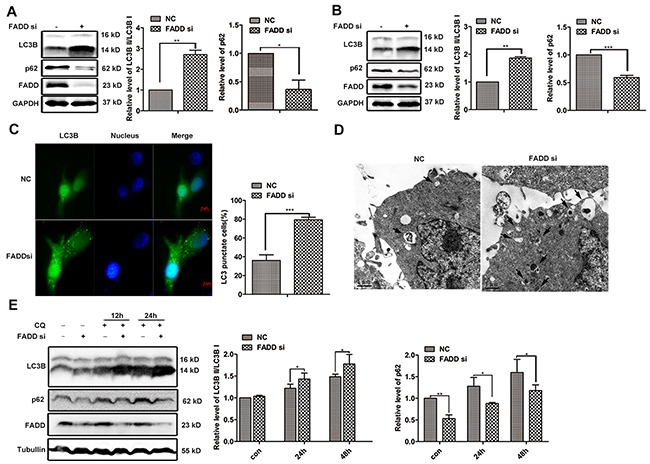
MCF-7 A. or MDA-MB-231 B. cells were transfected with FADD siRNA/NC for 48 h. LC3B and p62 were detected by western blotting. Band intensity was quantified. Each bar is the mean of 4 independent experiments. C. MCF-7 cells were transfected with GFP-LC3 plasmid together with FADD siRNA/NC for 48 h. Formation of vacuoles containing GFP-LC3 (dots) was examined by fluorescence microscopy. Scale bar: 5 μm. D. MCF-7 cells were transfected with FADD siRNA/NC for 48 h and then conducted to transmission electron microscopy (TEM) analysis. Representative image of different experiment was shown. Scale bar: 1 μm. E. MCF-7 cells were transfected with FADD siRNA/NC for 24 h and then treated with 20 μM chloroquine (CQ) at indicated times. Cell lysates were detected by western blotting (n=3). Each bar is the mean of 3 independent experiments. Data are represented as mean ± S.D. *p < 0.05; **p < 0.01; ***p < 0.001.