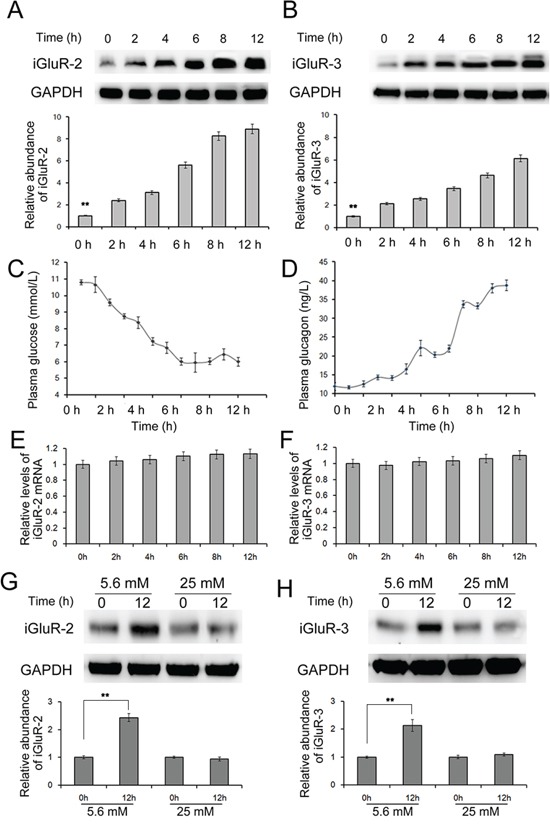
Figure 1. The effects of decreased glucose on the expression of iGluR2/3.

20 C57/BL6 mice were fasted for 12 hours, and islets were isolated to determine expression of iGluR2 A. and iGluR3 B. through western blotting (n=5); C-D. the blood glucose (C) and blood glucagon (D) levels were also detected (n=5); E-F. relative mRNA levels of iGluR2 (E) and iGluR3 (F) in mouse islets (n=5). G-H. Isolated mouse islets were cultured in DMEM containing different concentrations of glucose (n=5). The protein levels of iGluR2 (G) and iGluR3 (H) in mouse islets treated with 5.6/25 mM glucose. ** indicates p<0.01.
