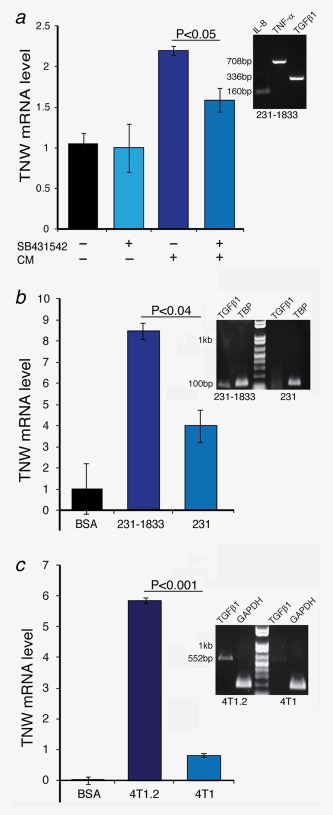
Figure 6.

Induction of TNW in BMSCs by MDA‐MB231‐1833‐ and 4T1.2‐conditioned media. (a) BMSCs at 70% confluence were washed with PBS and maintained in serum‐free α‐MEM with or without the addition of 10 µM SB‐431542 inhibitor for 1 hr. Following SB‐431542 treatment, BMSCs were exposed to conditioned medium from MDA‐MB231‐1833 cells. Total RNA was extracted and TNW transcript levels were analyzed by qRT‐PCR in comparison to the endogenous hTBP. Relative mRNA levels were normalized to the nontreated control cells using the ΔΔCt method. The agarose gel to the right shows RT‐PCRs from RNA isolated from MDA‐MB231‐1833 cells to reveal the presence of hTGFβ1 (336bp), hIL‐8 (160bp) and hTNF‐α (708bp) transcripts in MDA‐MB231‐1833 cells. (b) BMSCs at 70% confluence were washed with PBS and either maintained in serum‐free α‐MEM/0.2% BSA as control (BSA) or conditioned media from MDA‐MB231 or MDA‐MB231‐1833 cells. Total RNA was extracted and TNW transcript levels were analyzed by qRT‐PCR in comparison to the endogenous TBP. Relative mRNA levels were normalized to the nontreated control cells using the ΔΔCt method. The agarose gel to the right shows RT‐PCRs from RNA isolated from MDA‐MB231‐1833 versus MDA‐MB231 cells to reveal the presence of hTGFβ1 (101bp) relative to hTBP (132). (c) BMSCs at 70% confluence were washed with PBS and either maintained in serum‐free α‐MEM/0.2% BSA as control (BSA) or conditioned media from 4T1.2 or 4T1 cells. Total RNA was extracted and TNW transcript levels were analyzed by qRT‐PCR in comparison to the endogenous mGAPDH. Relative mRNA levels were normalized to the nontreated control cells using the ΔΔCt method. The agarose gel to the right shows RT‐PCRs from RNA isolated from 4T1.2 versus 4T1 cells to reveal the presence of mTGFβ1 (552bp) relative to mGAPDH (189). [Color figure can be viewed in the online issue, which is available at wileyonlinelibrary.com.]
