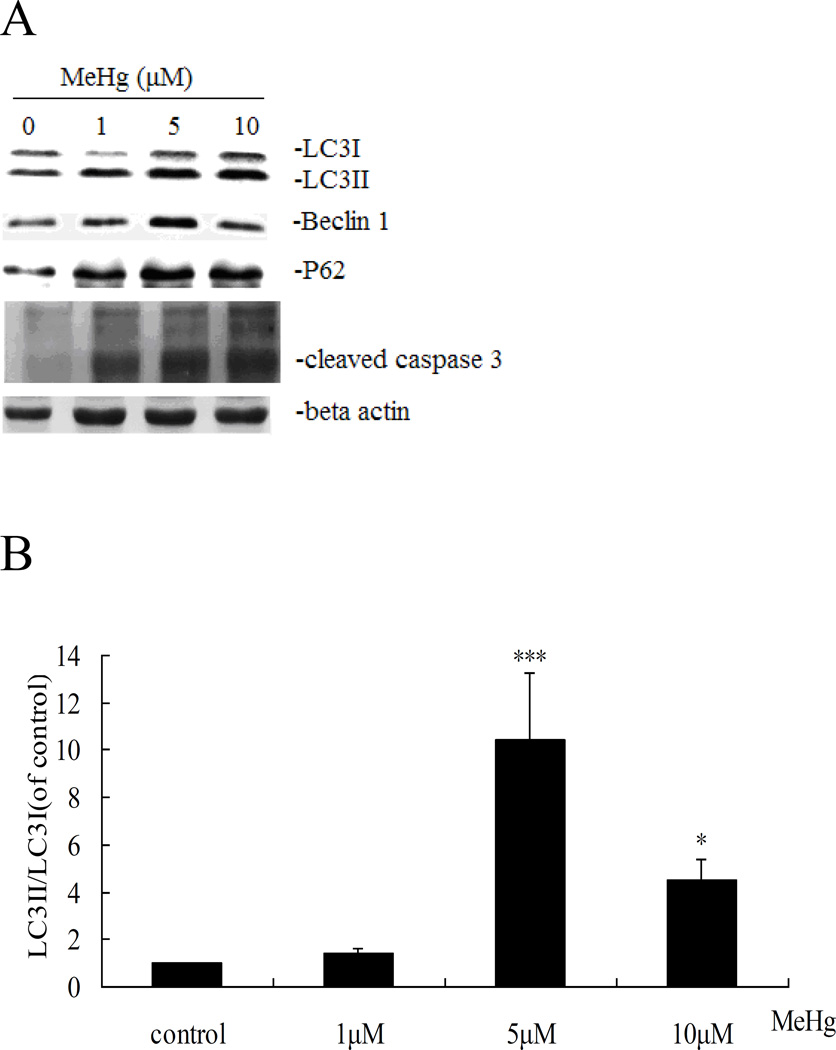
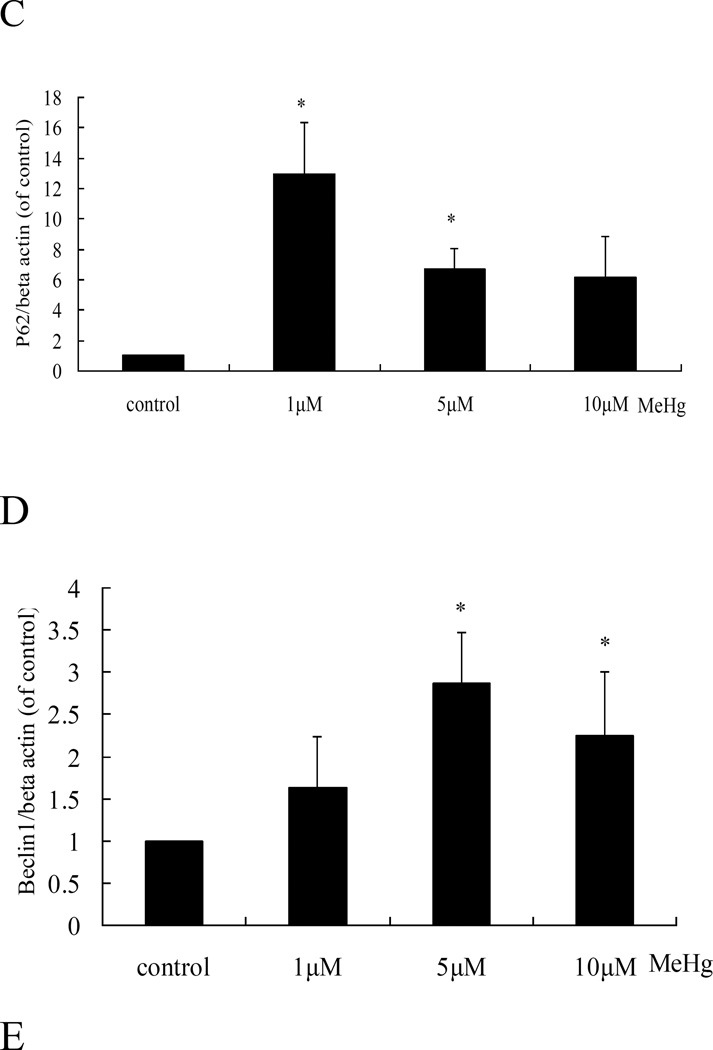
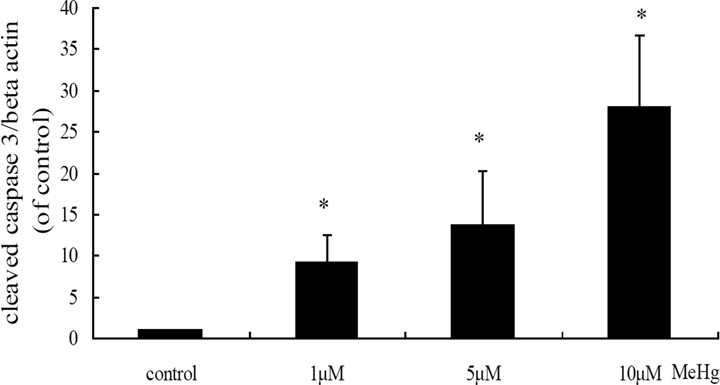
Figure 4.
Autophagy-related protein expression in MeHg-treated astrocytes. A: Cells were treated for 6 hours with MeHg (0µM, 1µM, 5µM or 10µM). The cytoplasmic protein fraction was analyzed by western blotting. β-actin was taken as internal control. B–E: Densitometric analyses of LC3B, Beclin 1, P62, and cleaved caspase 3 in MeHg-treated astrocytes. Relative expression was expressed as a percentage of β-actin, which was used for loading controls across the various lanes. The figures are representative of one of three independent experiments. Statistical analysis was carried out by one-way ANOVA followed by Dunnett test. Values represent means ± SD.*: P<0.05 compared to the control group.


