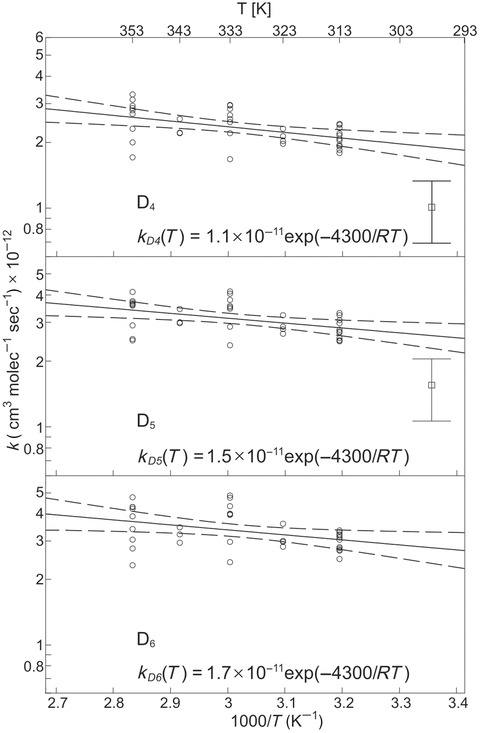
Figure 5.

Arrhenius plots of measured reaction rate constants of D4, D5, and D6 with OH calculated from experimental data with Eq. (5). The solid lines show the log‐linear regressions from a linear mixed model used to evaluate the activation energies, and the dotted lines show the 95% confidence intervals for the slope of the regression. Reaction rates of D4 and D5 from smog chamber studies 18 are shown as squares together with their corresponding 95% CI.
