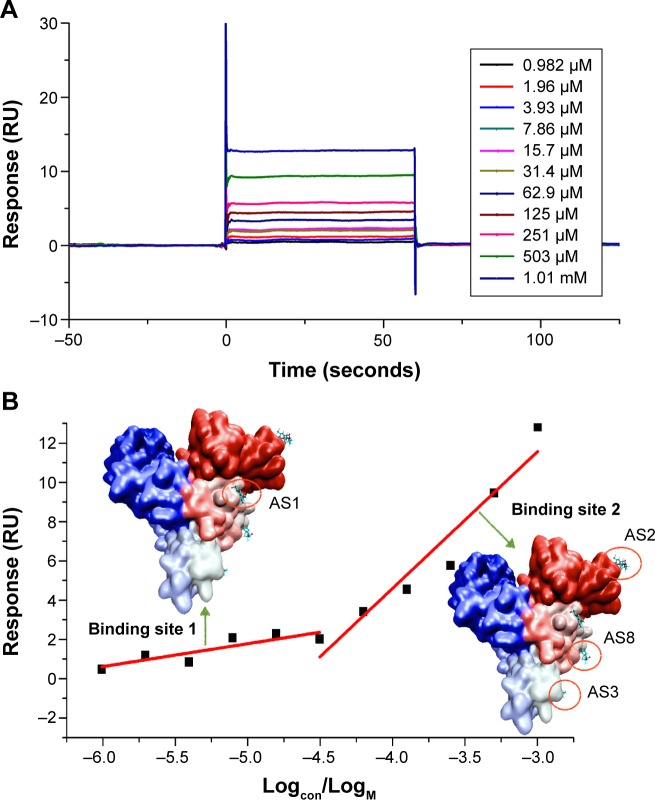
Figure 4.
SPR dose–response sensorgrams of AS with immobilized BSA.
Notes: (A) Response curve of different concentrations of AS from 0.982 μM to 1.01 mM with twofold dilution. (B) Fitting of response and AS concentrations to 1:1 Langmuir binding model using Biacore T200 Evaluation software version 2.0.
Abbreviations: SPR, surface plasmon resonance; AS, albuterol sulfate; BSA, bovine serum albumin.

