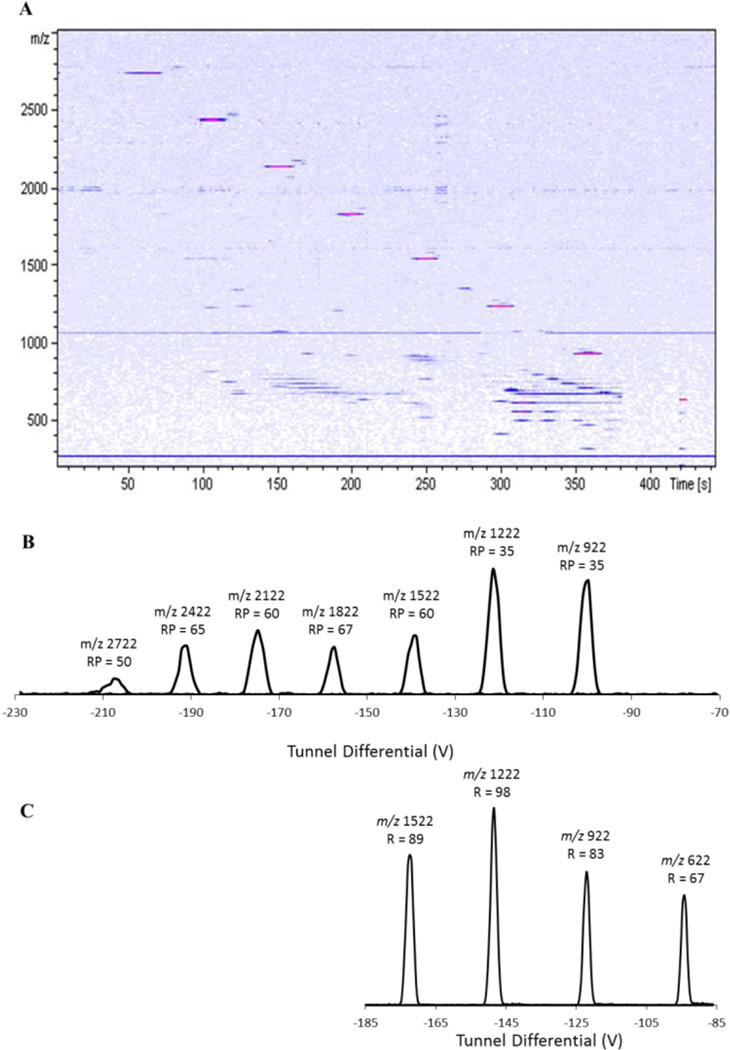
Figure 2.
A. Heatmap of m/z vs. elution time from a low ion mobility resolution analysis of Agilent Tune Mix. B. Extracted ion mobiligrams of each component of tune mix with their m/z and resolving power. C. High resolution extracted ion mobiligrams from the high ion mobility resolution analysis of the Agilent Tune Mix.

