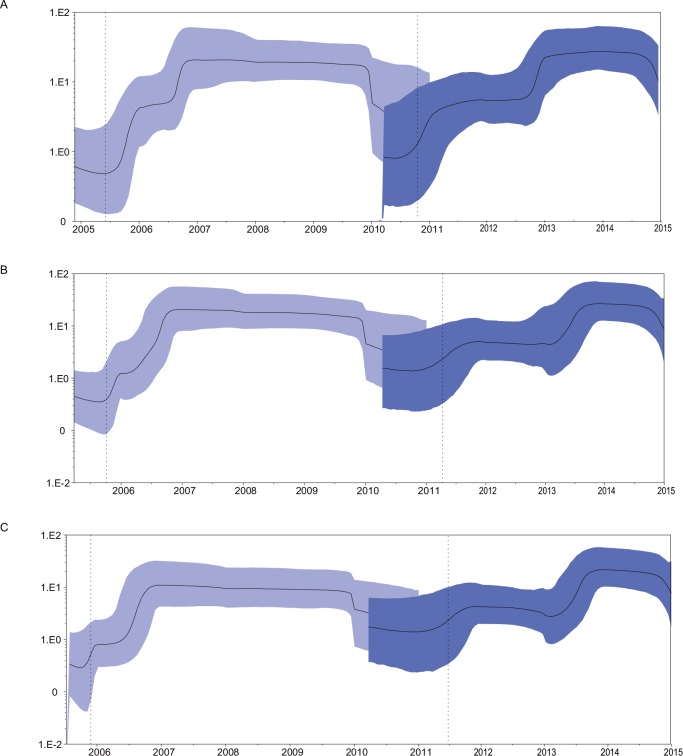
Fig 3. Bayesian skyline plot of the VP1 sequences of Den Haag_2006b variant (n = 64, lightblue) and Sydney_2012 variant (n = 73, darkblue).
The Bayesian skyline plot was estimated under the HKY+I+G4 model. The MCMC chains were run for 100,000,000 steps. The Y-axis represents the effective population size on a logarithmic scale and the X-axis represents generation time (year). The solid black line represents the median posterior value over time. The 95% Highest Probability Density (HPD) intervals are shown as a shaded blue area. The lower value of the HPD95% interval and the mean value for the TMRCA are shown as a vertical dotted line. (A) Bayesian skyline plot estimated by strict molecular clock. (B) Bayesian skyline plot estimated by uncorrelated log-normal clock (UCLN). (C) Bayesian skyline plot estimated by uncorrelated exponential deviation clock (UCED).

