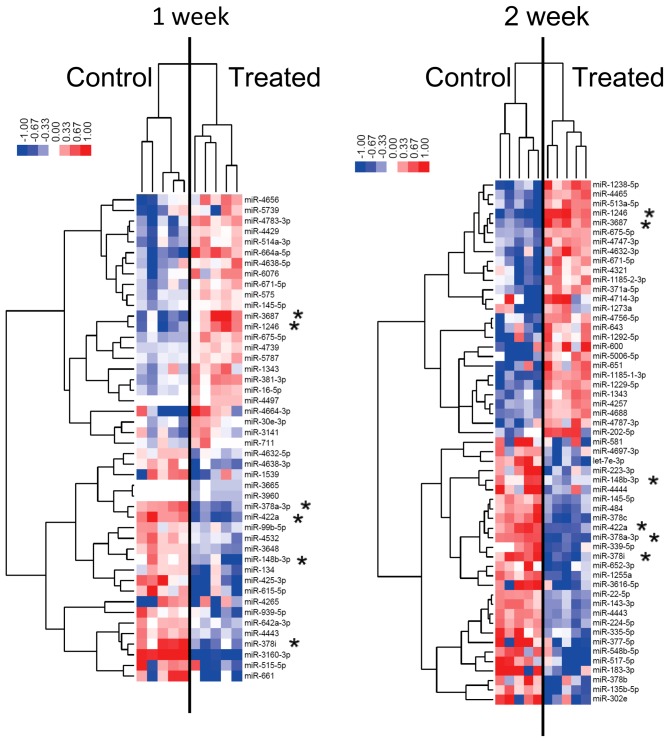
Figure 2.
Hierarchical clustering of miRNAs from HPrAD-vis cells. Hierarchical clustering was performed for miRNA expression profiles of control HPrAD-vis cells and cells cultured with 5 mM metformin for 1 (left-side panel) or 2 weeks (left-side panel). The samples are arranged in columns and miRNAs in rows. The miRNA clustering tree is shown on the left, and the sample clustering tree is shown at the top of each heat map. The heat maps show the relative expression intensity for each miRNA in which the base-2 logarithm of the intensity is median-centered for each row. The color-coding is indicated as a horizontal bar at the bottom left. The six miRNAs with an asterisk are common between data from 1 week incubation with metformin (P<0.05) and 2 weeks incubation with the reagent (P<0.005) regardless of fold-change (n=5). miRNAs, microRNAs; HPrAD-vis, human visceral preadipocytes.

